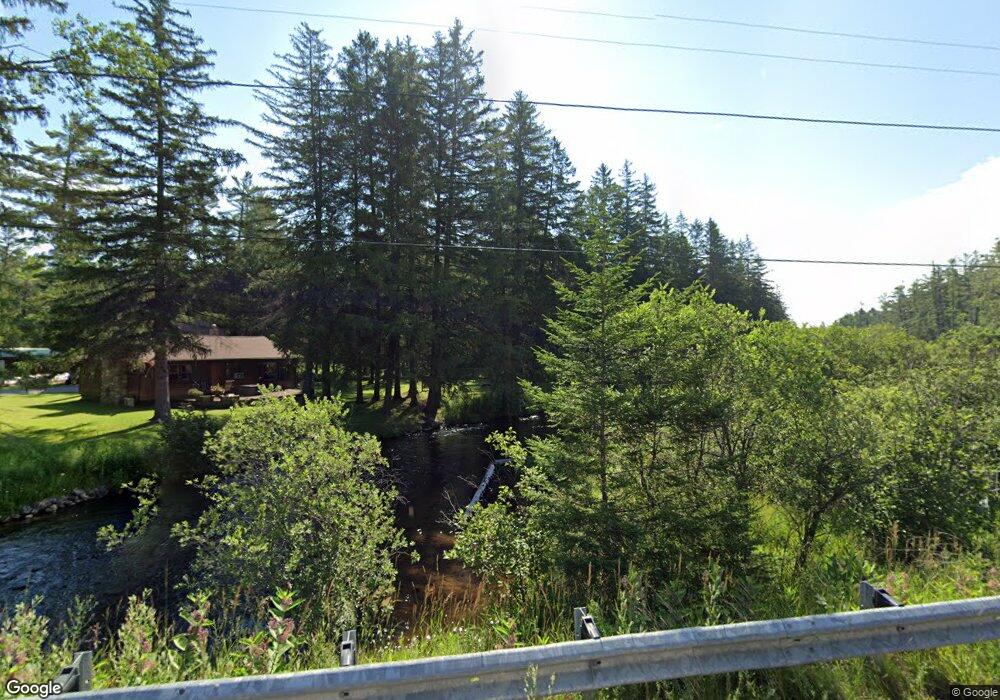
9742 Twin Bridge Rd Grayling, MI 49738
Estimated Value: $298,000 - $394,722
4
Beds
3
Baths
1,904
Sq Ft
$185/Sq Ft
Est. Value
About This Home
This home is located at 9742 Twin Bridge Rd, Grayling, MI 49738 and is currently estimated at $352,181, approximately $184 per square foot. 9742 Twin Bridge Rd is a home with nearby schools including Grayling Elementary School, Grayling Middle School, and Grayling High School.
Ownership History
Date
Name
Owned For
Owner Type
Purchase Details
Closed on
Jan 1, 1999
Sold by
Lewis Gabriel N and Lewis Pamela L
Current Estimated Value
Purchase Details
Closed on
Oct 2, 1998
Sold by
Lewis Gabriel N and Lewis Pamela L
Bought by
Walawender Richard A and Walawender Brenda
Purchase Details
Closed on
Sep 26, 1998
Sold by
Lewis Gabriel N and Lewis Pamela L
Bought by
Walawender Richard A and Walawender Brenda
Purchase Details
Closed on
Sep 11, 1990
Sold by
Mcclurg Richard and Mcclurg Ruth
Bought by
Lewis Gabriel and Lewis Pamela
Purchase Details
Closed on
Jul 1, 1986
Bought by
Lewis
Purchase Details
Closed on
Sep 29, 1983
Sold by
Calkins Paul and Calkins Julia
Bought by
Mcclurg Richard and Mcclurg Ruth
Purchase Details
Closed on
Feb 24, 1983
Sold by
Calkins Paul and Calkins Julia
Bought by
Mcclurg Richard and Mcclurg Ruth E
Purchase Details
Closed on
Jan 17, 1983
Sold by
Mcclurg Richard and Mcclurg Ruth
Bought by
Calkins Paul and Calkins Julia
Create a Home Valuation Report for This Property
The Home Valuation Report is an in-depth analysis detailing your home's value as well as a comparison with similar homes in the area
Purchase History
| Date | Buyer | Sale Price | Title Company |
|---|---|---|---|
| -- | -- | -- | |
| Walawender Richard A | $160,000 | -- | |
| Walawender Richard A | $160,000 | -- | |
| Lewis Gabriel | $80,000 | -- | |
| Lewis | $80,000 | -- | |
| Mcclurg Richard | -- | -- | |
| Mcclurg Richard | -- | -- | |
| Calkins Paul | -- | -- |
Source: Public Records
Tax History
| Year | Tax Paid | Tax Assessment Tax Assessment Total Assessment is a certain percentage of the fair market value that is determined by local assessors to be the total taxable value of land and additions on the property. | Land | Improvement |
|---|---|---|---|---|
| 2025 | $4,125 | $145,000 | $40,900 | $104,100 |
| 2024 | $4,045 | $137,200 | $40,900 | $96,300 |
| 2023 | $3,879 | $111,400 | $40,900 | $70,500 |
| 2022 | $3,730 | $110,800 | $40,900 | $69,900 |
| 2021 | $4,701 | $105,600 | $40,900 | $64,700 |
| 2020 | $4,636 | $102,600 | $40,900 | $61,700 |
| 2019 | $4,717 | $104,800 | $40,900 | $63,900 |
| 2018 | $4,861 | $107,500 | $40,900 | $66,600 |
| 2017 | $4,046 | $114,100 | $40,900 | $73,200 |
| 2016 | $4,011 | $110,200 | $40,900 | $69,300 |
| 2015 | -- | $110,200 | $0 | $0 |
| 2014 | -- | $118,400 | $0 | $0 |
| 2013 | -- | $109,200 | $0 | $0 |
Source: Public Records
Map
Nearby Homes
- 11858 Crapo Lake Rd
- 7727 Bald Hill Rd
- 80 Lovells Rd
- 0 Lovells Rd Unit 1933430
- 11551 Enchanted Dr
- 11800 Goodfellow Dr
- 1161 Lagoon St
- 11643 Huntingdon Dr
- Lot 222 Fascination Dr
- Lot 297 Nottingham Dr
- 2845 Oak Ave
- 11468 Sherwood Dr
- 11456 Sherwood Dr
- Parcel 1 Thunder Mug Rd
- 3290 Skyline Rd
- 3123 Lovells Rd
- 126 Long Dr
- 00 E North Down River Rd
- 1980 County Road 612
- 0000 E North Down River Rd
- 9761 Twin Bridge Rd
- 5561 Spear Trail
- 9921 Twin Bridge Rd
- 9921 Twin Bridge Rd
- 5715 Willow Banks Rd
- 9983 Twin Bridge Rd
- 5695 Willow Banks Rd
- 5803 Spear Trail
- 9892 Twin Bridge Rd
- 10129 Twin Bridge Rd
- 0 Spear Trail Unit 20812995
- 0 Spear Trail Unit (3.5 Acres) 281294
- 0 Spear Trail Unit 252491
- 0 Spear Trail Unit 78080026664
- 0 Spear Trail Unit 3.22 ACRES 325336
- 9826 Cook Trail
- 10023 Twin Bridge Rd
- 9950 Ski Hill Rd
- 9792 Cook
- 9774 Cook Trail
Your Personal Tour Guide
Ask me questions while you tour the home.