Estimated Value: $560,000 - $574,000
4
Beds
2
Baths
1,314
Sq Ft
$433/Sq Ft
Est. Value
About This Home
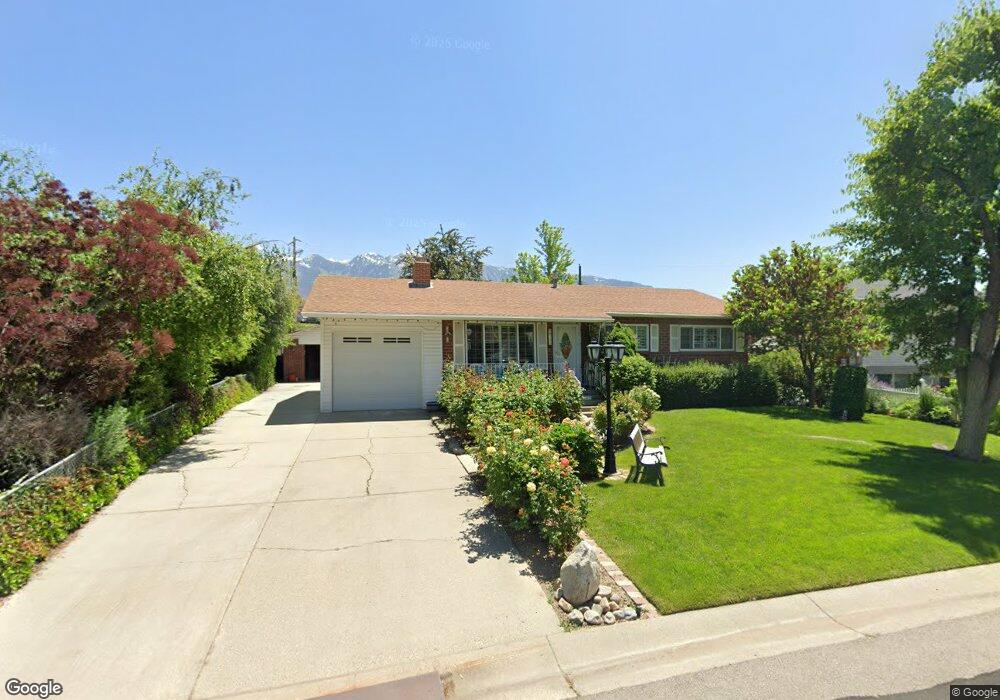
This home is located at 9743 Silica Dr, Sandy, UT 84094 and is currently estimated at $568,492, approximately $432 per square foot. 9743 Silica Dr is a home located in Salt Lake County with nearby schools including Crescent Elementary School, Eastmont Middle School, and Jordan High.
Ownership History
Date
Name
Owned For
Owner Type
Purchase Details
Closed on
Aug 12, 2009
Sold by
Harrington James K and Harrington Joan S
Bought by
Harrington James K and Harrington Joan S
Current Estimated Value
Purchase Details
Closed on
Feb 20, 1998
Sold by
Harrington James K and Harrington Joan S
Bought by
Harrington James K and Harrington Joan S
Home Financials for this Owner
Home Financials are based on the most recent Mortgage that was taken out on this home.
Original Mortgage
$50,000
Outstanding Balance
$8,773
Interest Rate
6.9%
Estimated Equity
$559,719
Create a Home Valuation Report for This Property
The Home Valuation Report is an in-depth analysis detailing your home's value as well as a comparison with similar homes in the area
Home Values in the Area
Average Home Value in this Area
Purchase History
| Date | Buyer | Sale Price | Title Company |
|---|---|---|---|
| Harrington James K | -- | None Available | |
| Harrington James K | -- | -- | |
| Harrington James K | -- | -- |
Source: Public Records
Mortgage History
| Date | Status | Borrower | Loan Amount |
|---|---|---|---|
| Open | Harrington James K | $50,000 |
Source: Public Records
Tax History Compared to Growth
Tax History
| Year | Tax Paid | Tax Assessment Tax Assessment Total Assessment is a certain percentage of the fair market value that is determined by local assessors to be the total taxable value of land and additions on the property. | Land | Improvement |
|---|---|---|---|---|
| 2025 | $3,492 | $544,400 | $121,100 | $423,300 |
| 2024 | $3,492 | $522,500 | $113,200 | $409,300 |
| 2023 | $3,065 | $448,600 | $107,600 | $341,000 |
| 2022 | $3,156 | $457,000 | $105,500 | $351,500 |
| 2021 | $2,688 | $340,700 | $82,000 | $258,700 |
| 2020 | $2,635 | $312,400 | $82,000 | $230,400 |
| 2019 | $2,397 | $281,800 | $77,400 | $204,400 |
| 2018 | $2,118 | $251,300 | $77,400 | $173,900 |
| 2017 | $2,088 | $242,700 | $77,400 | $165,300 |
| 2016 | $1,974 | $224,700 | $77,400 | $147,300 |
| 2015 | $1,919 | $203,000 | $75,100 | $127,900 |
| 2014 | $1,982 | $203,800 | $76,600 | $127,200 |
Source: Public Records
Map
Nearby Homes
- 1060 E Sleepy Hollow Ln
- 9898 S Barium Ln
- 9886 S Antimony Ln
- 1124 E Sleepy Hollow Ln
- 1058 S Turquoise Way
- 1077 S Turquoise Way
- 9534 S Poppy Ln
- 9968 S Flint Dr
- 1199 E Tiger Eye Dr
- 1100 E Webster Dr
- 956 E Sego Lily Dr
- 9439 S Meckailee Cove
- 9750 S Indian Ridge Dr
- 9593 S 700 E
- 9977 Lannae Dr
- 1356 Eastpoint Dr
- 9968 S Blossom Dr
- 1157 E Sego Lily Dr
- 9835 S 610 E
- 665 E Howard Dr
- 9733 Silica Dr
- 9751 Silica Dr
- 9751 S Silica Dr
- 9725 Silica Dr
- 9759 S Silica Dr
- 9725 S Silica Dr
- 9759 Silica Dr
- 9738 Silica Dr
- 9728 Silica Dr
- 9750 Silica Dr
- 9750 S Silica Dr
- 9769 Silica Dr
- 9715 Silica Dr
- 9769 S Silica Dr
- 9760 Silica Dr
- 9718 S Silica Dr
- 9718 Silica Dr
- 986 Jade Cir
- 986 E Jade Cir
- 9705 Silica Dr