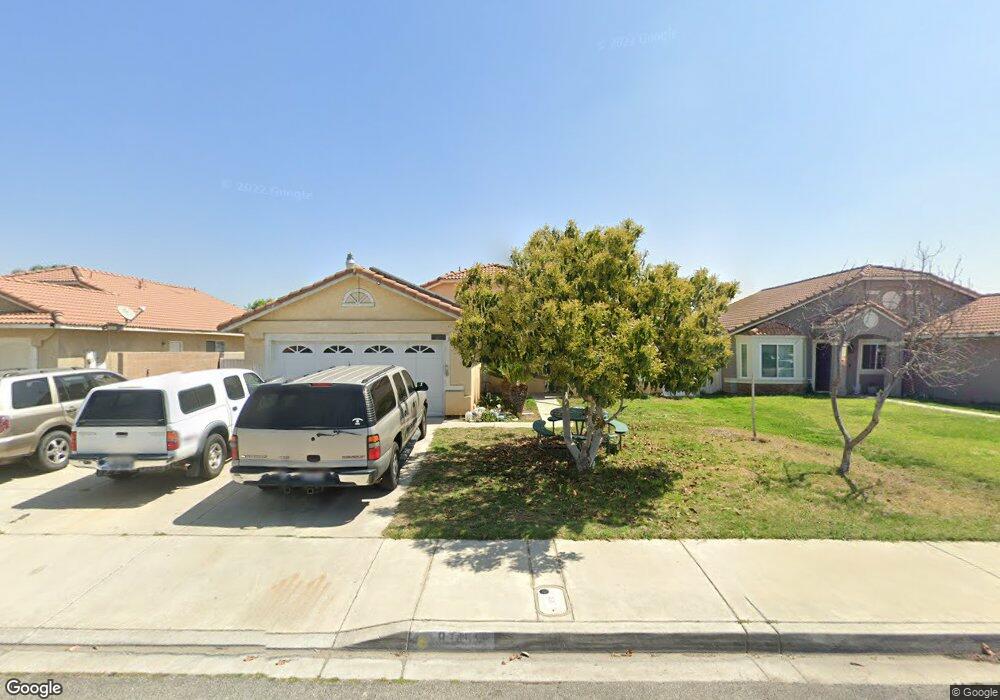
9745 Ashford Ave Bloomington, CA 92316
Estimated Value: $567,403 - $650,000
4
Beds
2
Baths
1,564
Sq Ft
$389/Sq Ft
Est. Value
About This Home
This home is located at 9745 Ashford Ave, Bloomington, CA 92316 and is currently estimated at $607,851, approximately $388 per square foot. 9745 Ashford Ave is a home located in San Bernardino County with nearby schools including Gerald A. Smith Elementary School, Joe Baca, and Bloomington High School.
Ownership History
Date
Name
Owned For
Owner Type
Purchase Details
Closed on
May 26, 1999
Sold by
Secretary Of Housing And Urban Dev
Bought by
Silva Joseph N and Silva Patricia A
Current Estimated Value
Home Financials for this Owner
Home Financials are based on the most recent Mortgage that was taken out on this home.
Original Mortgage
$57,157
Outstanding Balance
$15,310
Interest Rate
7.24%
Mortgage Type
FHA
Estimated Equity
$592,541
Purchase Details
Closed on
Oct 16, 1997
Sold by
Munoz Carlos Zamudio and Zamudio Jose Luis
Bought by
Countrywide Home Loans Inc
Purchase Details
Closed on
Oct 14, 1997
Sold by
Countrywide Home Loans Inc
Bought by
Hud
Purchase Details
Closed on
Jan 31, 1996
Sold by
G M Lavitt Inc
Bought by
Munoz Carlos Zamudio and Zamudio Jose Luis
Home Financials for this Owner
Home Financials are based on the most recent Mortgage that was taken out on this home.
Original Mortgage
$135,890
Interest Rate
7.25%
Mortgage Type
FHA
Create a Home Valuation Report for This Property
The Home Valuation Report is an in-depth analysis detailing your home's value as well as a comparison with similar homes in the area
Home Values in the Area
Average Home Value in this Area
Purchase History
| Date | Buyer | Sale Price | Title Company |
|---|---|---|---|
| Silva Joseph N | $100,000 | American Title | |
| Countrywide Home Loans Inc | $143,347 | Landsafe Title | |
| Hud | -- | Landsafe Title | |
| Munoz Carlos Zamudio | $138,000 | Orange Coast Title |
Source: Public Records
Mortgage History
| Date | Status | Borrower | Loan Amount |
|---|---|---|---|
| Open | Silva Joseph N | $57,157 | |
| Previous Owner | Munoz Carlos Zamudio | $135,890 |
Source: Public Records
Tax History Compared to Growth
Tax History
| Year | Tax Paid | Tax Assessment Tax Assessment Total Assessment is a certain percentage of the fair market value that is determined by local assessors to be the total taxable value of land and additions on the property. | Land | Improvement |
|---|---|---|---|---|
| 2025 | $2,198 | $172,139 | $43,035 | $129,104 |
| 2024 | $2,198 | $168,764 | $42,191 | $126,573 |
| 2023 | $2,196 | $165,455 | $41,364 | $124,091 |
| 2022 | $2,162 | $162,211 | $40,553 | $121,658 |
| 2021 | $2,195 | $159,031 | $39,758 | $119,273 |
| 2020 | $2,198 | $157,400 | $39,350 | $118,050 |
| 2019 | $2,142 | $154,313 | $38,578 | $115,735 |
| 2018 | $1,952 | $151,288 | $37,822 | $113,466 |
| 2017 | $1,883 | $148,321 | $37,080 | $111,241 |
| 2016 | $1,928 | $145,413 | $36,353 | $109,060 |
| 2015 | $1,867 | $143,229 | $35,807 | $107,422 |
| 2014 | $1,797 | $140,424 | $35,106 | $105,318 |
Source: Public Records
Map
Nearby Homes
- 18325 El Molino St
- 9824 Linden Ave
- 9562 Locust Ave
- 18042 Marygold Ave
- 9649 Grace St
- 9971 Cedar Ave
- 9967 Cedar Ave
- 1228 W Woodcrest St
- 806 S Sandalwood Ave
- 18264 Pine Ave Unit a & B
- 18264 Pine Ave
- 10134 Cedar Place
- 1560 W Athol St
- 1028 W Woodcrest St
- 9838 Alder Ave
- 1459 W James St
- 9050 Dumond Dr
- 10022 Alameda Ave
- 9823 Lombardy Ave
- 1154 S Spruce Ave
- 9735 Ashford Ave
- 9755 Ashford Ave
- 9725 Ashford Ave
- 9765 Ashford Ave
- 9750 Forest Ave
- 9762 Forest Ave
- 9738 Forest Ave
- 9774 Forest Ave
- 9775 Ashford Ave
- 9726 Forest Ave
- 9750 Ashford Ave
- 9730 Ashford Ave
- 9715 Ashford Ave
- 9786 Forest Ave
- 9760 Ashford Ave
- 9714 Forest Ave
- 9720 Ashford Ave
- 9785 Ashford Ave
- 9770 Ashford Ave
- 9705 Ashford Ave