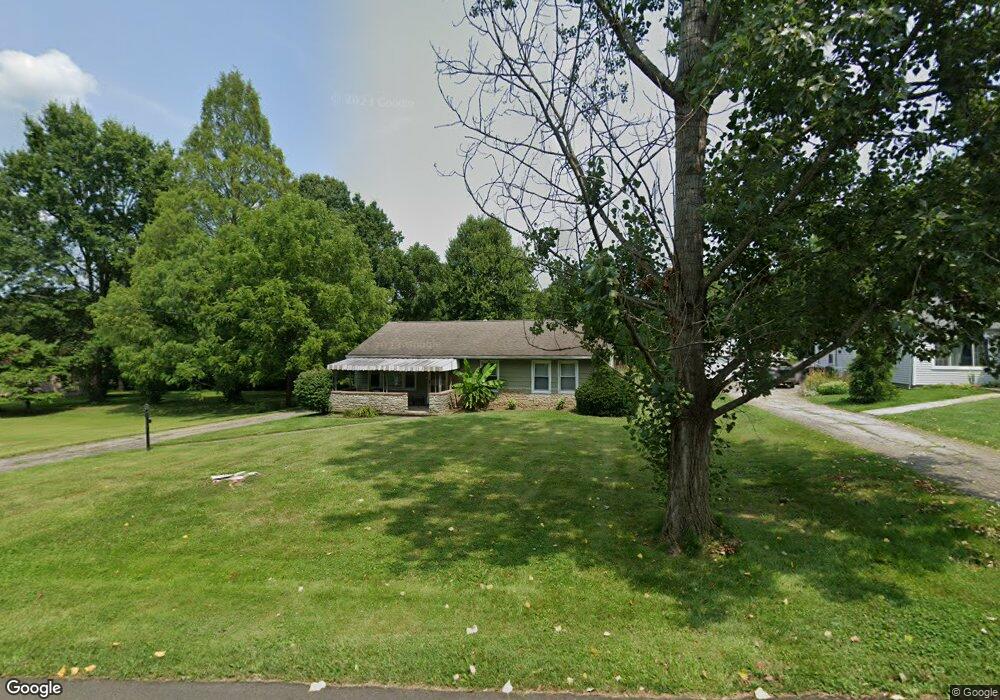
9748 Northfield Ln Cincinnati, OH 45231
Winton Lake NeighborhoodEstimated Value: $156,478 - $215,000
3
Beds
1
Bath
984
Sq Ft
$185/Sq Ft
Est. Value
About This Home
This home is located at 9748 Northfield Ln, Cincinnati, OH 45231 and is currently estimated at $181,870, approximately $184 per square foot. 9748 Northfield Ln is a home located in Hamilton County with nearby schools including John Paul II Catholic School.
Ownership History
Date
Name
Owned For
Owner Type
Purchase Details
Closed on
Jun 5, 2014
Sold by
Knepp Linda L and Knepp Edward P
Bought by
Knepp Robert Irvin and Knepp Jody Ann
Current Estimated Value
Home Financials for this Owner
Home Financials are based on the most recent Mortgage that was taken out on this home.
Original Mortgage
$44,000
Outstanding Balance
$33,568
Interest Rate
4.28%
Mortgage Type
New Conventional
Estimated Equity
$148,302
Purchase Details
Closed on
May 19, 2014
Sold by
Neon Properties Llc
Bought by
Knepp Linda L
Home Financials for this Owner
Home Financials are based on the most recent Mortgage that was taken out on this home.
Original Mortgage
$44,000
Outstanding Balance
$33,568
Interest Rate
4.28%
Mortgage Type
New Conventional
Estimated Equity
$148,302
Purchase Details
Closed on
Jun 9, 2005
Sold by
Knepp Edward and Knepp Linda L
Bought by
Neon Properties Llc
Purchase Details
Closed on
May 23, 1997
Sold by
Mullen Kenneth and Mullen Ronald
Bought by
Knepp Edward and Knepp Linda L
Create a Home Valuation Report for This Property
The Home Valuation Report is an in-depth analysis detailing your home's value as well as a comparison with similar homes in the area
Home Values in the Area
Average Home Value in this Area
Purchase History
| Date | Buyer | Sale Price | Title Company |
|---|---|---|---|
| Knepp Robert Irvin | $55,000 | Attorney | |
| Knepp Linda L | -- | Attorney | |
| Neon Properties Llc | -- | None Available | |
| Knepp Edward | $35,200 | -- |
Source: Public Records
Mortgage History
| Date | Status | Borrower | Loan Amount |
|---|---|---|---|
| Open | Knepp Robert Irvin | $44,000 |
Source: Public Records
Tax History Compared to Growth
Tax History
| Year | Tax Paid | Tax Assessment Tax Assessment Total Assessment is a certain percentage of the fair market value that is determined by local assessors to be the total taxable value of land and additions on the property. | Land | Improvement |
|---|---|---|---|---|
| 2024 | $2,733 | $39,407 | $12,964 | $26,443 |
| 2023 | $2,581 | $39,407 | $12,964 | $26,443 |
| 2022 | $2,318 | $26,569 | $10,304 | $16,265 |
| 2021 | $2,312 | $26,569 | $10,304 | $16,265 |
| 2020 | $2,285 | $26,569 | $10,304 | $16,265 |
| 2019 | $2,116 | $22,516 | $8,733 | $13,783 |
| 2018 | $2,119 | $22,516 | $8,733 | $13,783 |
| 2017 | $2,067 | $22,516 | $8,733 | $13,783 |
| 2016 | $1,826 | $19,250 | $8,617 | $10,633 |
| 2015 | $1,685 | $19,250 | $8,617 | $10,633 |
| 2014 | $1,676 | $19,250 | $8,617 | $10,633 |
| 2013 | $2,172 | $25,820 | $9,905 | $15,915 |
Source: Public Records
Map
Nearby Homes
- 9413 Stoneybrooke
- 10040 Daly Rd
- 1031 Lost Crossing
- 1050 Meredith Dr
- 1372 Riviera Place
- 9696 Wymart Ave
- 9315 Winton Rd
- 9319 Winton Rd
- 9320 Rambler Place
- 822 Compton Rd
- 820 Compton Rd
- 831 Compton Rd
- 9731 Culpepper Ct
- 1100 Gracewind Ct
- 1190 Sugartree Ct
- 9132 Millcliff Dr
- 1503 Covered Bridge Rd
- 8950 Daly Rd
- 8925 Monsanto Dr
- 9416 Shadyoak Ct
- 9738 Northfield Ln
- 9726 Northfield Ln
- 9747 Northfield Ln
- 9737 Northfield Ln
- 1093 Mckelvey Rd
- 9759 Northfield Ln
- 1087 Mckelvey Rd
- 1081 Mckelvey Rd
- 9716 Northfield Ln
- 9715 Northfield Ln
- 1056 Sunwood Ct
- 1109 Mckelvey Rd
- 9704 Northfield Ln
- 1075 Mckelvey Rd
- 1052 Sunwood Ct
- 1053 Sunwood Ct
- 9703 Northfield Ln
- 9703 Northfield Ln
- 1113 Mckelvey Rd
- 1065 Mckelvey Rd