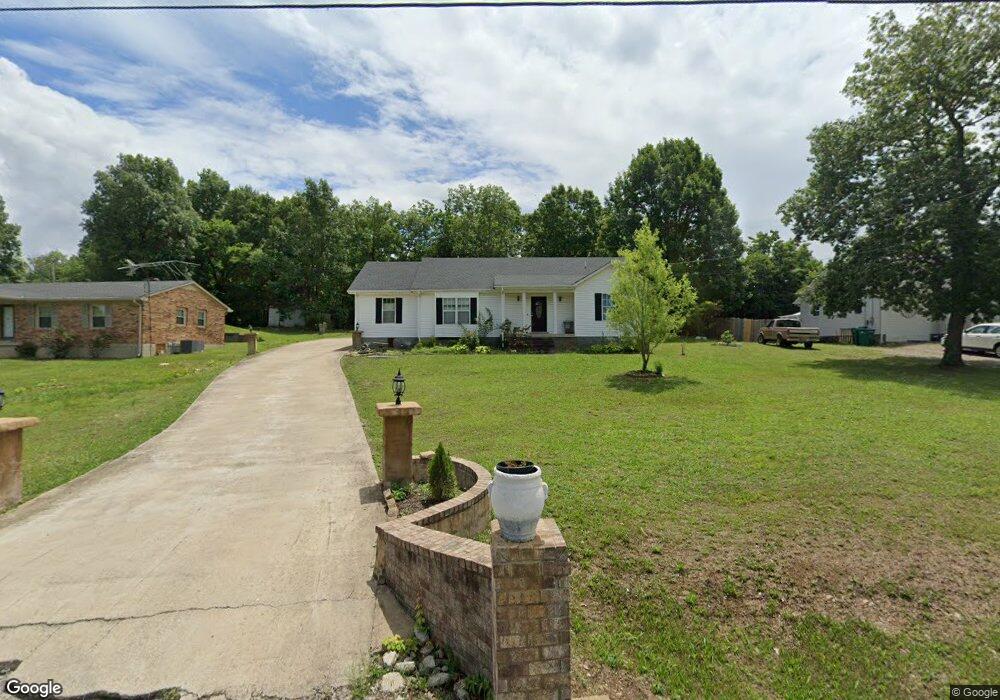
975 Cheryl Dr Lewisburg, TN 37091
Estimated Value: $230,000 - $287,000
--
Bed
2
Baths
1,502
Sq Ft
$174/Sq Ft
Est. Value
About This Home
This home is located at 975 Cheryl Dr, Lewisburg, TN 37091 and is currently estimated at $261,016, approximately $173 per square foot. 975 Cheryl Dr is a home located in Marshall County with nearby schools including Marshall Elementary School, Oak Grove Elementary School, and Westhills Elementary School.
Ownership History
Date
Name
Owned For
Owner Type
Purchase Details
Closed on
Sep 6, 2011
Sold by
Bank Of New York Mellon Tr
Bought by
Garcia Eleuterio and Boyzo Gricelda
Current Estimated Value
Home Financials for this Owner
Home Financials are based on the most recent Mortgage that was taken out on this home.
Original Mortgage
$52,942
Outstanding Balance
$36,220
Interest Rate
4.24%
Mortgage Type
Commercial
Estimated Equity
$224,796
Purchase Details
Closed on
Apr 5, 2011
Sold by
Gonzalez Claudia I
Bought by
Bank Of New York Mellon Tr
Purchase Details
Closed on
Jan 5, 2007
Sold by
Poarch Linda D
Bought by
Claudia Gonzalez
Home Financials for this Owner
Home Financials are based on the most recent Mortgage that was taken out on this home.
Original Mortgage
$73,600
Interest Rate
8.99%
Purchase Details
Closed on
Aug 18, 2004
Sold by
Jeff Poarch
Bought by
Linda Poarch
Purchase Details
Closed on
Jul 13, 1992
Bought by
David Jent and Edens Bobby
Create a Home Valuation Report for This Property
The Home Valuation Report is an in-depth analysis detailing your home's value as well as a comparison with similar homes in the area
Home Values in the Area
Average Home Value in this Area
Purchase History
| Date | Buyer | Sale Price | Title Company |
|---|---|---|---|
| Garcia Eleuterio | $64,000 | -- | |
| Bank Of New York Mellon Tr | $73,793 | -- | |
| Claudia Gonzalez | $92,000 | -- | |
| Linda Poarch | -- | -- | |
| David Jent | $14,000 | -- |
Source: Public Records
Mortgage History
| Date | Status | Borrower | Loan Amount |
|---|---|---|---|
| Open | Garcia Eleuterio | $52,942 | |
| Previous Owner | David Jent | $73,600 |
Source: Public Records
Tax History Compared to Growth
Tax History
| Year | Tax Paid | Tax Assessment Tax Assessment Total Assessment is a certain percentage of the fair market value that is determined by local assessors to be the total taxable value of land and additions on the property. | Land | Improvement |
|---|---|---|---|---|
| 2024 | -- | $46,150 | $7,500 | $38,650 |
| 2023 | $1,432 | $46,150 | $7,500 | $38,650 |
| 2022 | $1,432 | $46,150 | $7,500 | $38,650 |
| 2021 | $1,371 | $29,475 | $4,500 | $24,975 |
| 2020 | $1,256 | $27,000 | $4,500 | $22,500 |
| 2019 | $1,216 | $27,000 | $4,500 | $22,500 |
| 2018 | $1,203 | $27,000 | $4,500 | $22,500 |
| 2017 | $1,203 | $27,000 | $4,500 | $22,500 |
| 2016 | $1,186 | $23,175 | $4,000 | $19,175 |
| 2015 | $1,082 | $23,175 | $4,000 | $19,175 |
| 2014 | $1,082 | $23,175 | $4,000 | $19,175 |
Source: Public Records
Map
Nearby Homes
- 104 Mackenzie Way
- MEDFORD Plan at King's Landing
- 1205 Maelee Ann Dr
- 125 Southview Dr
- 103 Mackenzie Way
- 147 Mackenzie Way
- 198 Southview Dr
- 149 Mackenzie Way
- 151 Mackenzie Way
- 153 Mackenzie Way
- 155 Mackenzie Way
- 157 Mackenzie Way
- 159 Mackenzie Way
- 301 Weston Dr
- 1011 Cornersville Rd
- 1235 Yell Rd
- 185 Southview Dr
- 1128 Moreno Ln
- 313 Pardo Dr
- 1361 Yell Rd