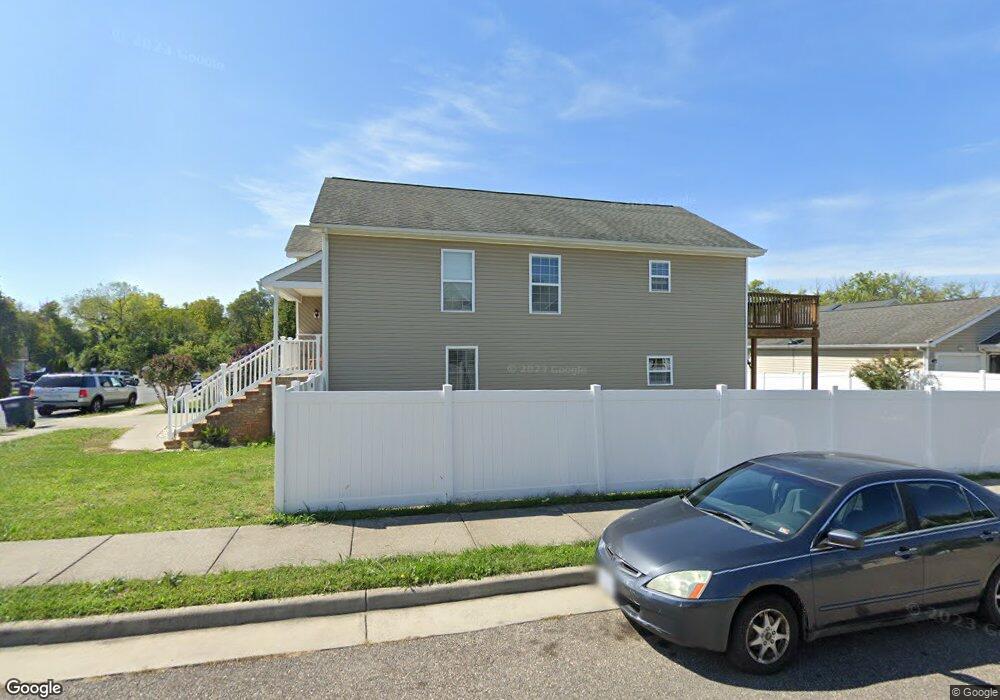
975 Drake Ln Harrisonburg, VA 22802
Estimated Value: $308,486 - $355,000
3
Beds
2
Baths
1,336
Sq Ft
$244/Sq Ft
Est. Value
About This Home
This home is located at 975 Drake Ln, Harrisonburg, VA 22802 and is currently estimated at $325,622, approximately $243 per square foot. 975 Drake Ln is a home located in Harrisonburg City with nearby schools including Waterman Elementary School, Thomas Harrison Middle School, and Harrisonburg High School.
Ownership History
Date
Name
Owned For
Owner Type
Purchase Details
Closed on
Nov 5, 2018
Sold by
Say Mark R and Say Christine G
Bought by
Cardoso Jazmin
Current Estimated Value
Home Financials for this Owner
Home Financials are based on the most recent Mortgage that was taken out on this home.
Original Mortgage
$180,400
Outstanding Balance
$156,353
Interest Rate
4.12%
Mortgage Type
Adjustable Rate Mortgage/ARM
Estimated Equity
$169,269
Create a Home Valuation Report for This Property
The Home Valuation Report is an in-depth analysis detailing your home's value as well as a comparison with similar homes in the area
Home Values in the Area
Average Home Value in this Area
Purchase History
| Date | Buyer | Sale Price | Title Company |
|---|---|---|---|
| Cardoso Jazmin | $189,900 | Clear Title Escrow & Settlem |
Source: Public Records
Mortgage History
| Date | Status | Borrower | Loan Amount |
|---|---|---|---|
| Open | Cardoso Jazmin | $180,400 |
Source: Public Records
Tax History Compared to Growth
Tax History
| Year | Tax Paid | Tax Assessment Tax Assessment Total Assessment is a certain percentage of the fair market value that is determined by local assessors to be the total taxable value of land and additions on the property. | Land | Improvement |
|---|---|---|---|---|
| 2024 | $2,695 | $266,800 | $41,800 | $225,000 |
| 2023 | $2,222 | $231,500 | $33,000 | $198,500 |
| 2022 | $2,066 | $222,100 | $30,000 | $192,100 |
| 2021 | $1,854 | $206,000 | $30,000 | $176,000 |
| 2020 | $1,702 | $195,100 | $30,000 | $165,100 |
| 2019 | $1,682 | $192,800 | $30,000 | $162,800 |
| 2018 | $1,216 | $188,100 | $30,000 | $158,100 |
| 2017 | $1,216 | $167,900 | $30,000 | $137,900 |
| 2016 | $1,216 | $167,900 | $30,000 | $137,900 |
| 2015 | $1,216 | $168,900 | $31,000 | $137,900 |
| 2014 | -- | $174,000 | $33,000 | $141,000 |
Source: Public Records
Map
Nearby Homes