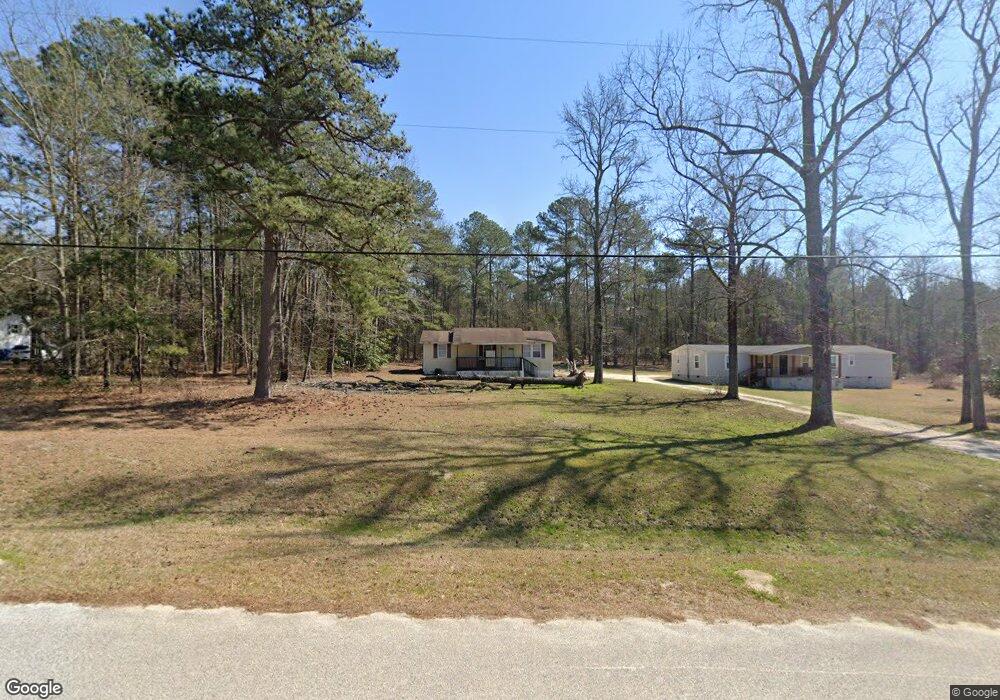
975 Macks Rd Harlem, GA 30814
Estimated Value: $118,407 - $168,000
2
Beds
1
Bath
880
Sq Ft
$169/Sq Ft
Est. Value
About This Home
This home is located at 975 Macks Rd, Harlem, GA 30814 and is currently estimated at $148,602, approximately $168 per square foot. 975 Macks Rd is a home located in Columbia County with nearby schools including North Harlem Elementary School, Harlem Middle School, and Harlem High School.
Ownership History
Date
Name
Owned For
Owner Type
Purchase Details
Closed on
Mar 16, 2023
Sold by
Dorn Michael
Bought by
Jones Investment Group Llc
Current Estimated Value
Home Financials for this Owner
Home Financials are based on the most recent Mortgage that was taken out on this home.
Original Mortgage
$196,452
Outstanding Balance
$35,375
Interest Rate
6.32%
Mortgage Type
New Conventional
Estimated Equity
$113,227
Purchase Details
Closed on
Oct 15, 2004
Sold by
Ingomar Lp
Bought by
Dorn Michael
Purchase Details
Closed on
Apr 1, 2003
Sold by
Martinez Nansy
Bought by
Ingomar Lp
Purchase Details
Closed on
Nov 3, 2000
Sold by
Dunn Dewayne Michael
Bought by
Martinez Nansy
Home Financials for this Owner
Home Financials are based on the most recent Mortgage that was taken out on this home.
Original Mortgage
$45,000
Interest Rate
11.24%
Create a Home Valuation Report for This Property
The Home Valuation Report is an in-depth analysis detailing your home's value as well as a comparison with similar homes in the area
Home Values in the Area
Average Home Value in this Area
Purchase History
| Date | Buyer | Sale Price | Title Company |
|---|---|---|---|
| Jones Investment Group Llc | $210,000 | -- | |
| Dorn Michael | $17,000 | -- | |
| Ingomar Lp | $23,500 | -- | |
| Martinez Nansy | $50,000 | -- | |
| Universal Mtg Source | $17,600 | -- |
Source: Public Records
Mortgage History
| Date | Status | Borrower | Loan Amount |
|---|---|---|---|
| Open | Jones Investment Group Llc | $196,452 | |
| Previous Owner | Martinez Nansy | $45,000 |
Source: Public Records
Tax History
| Year | Tax Paid | Tax Assessment Tax Assessment Total Assessment is a certain percentage of the fair market value that is determined by local assessors to be the total taxable value of land and additions on the property. | Land | Improvement |
|---|---|---|---|---|
| 2025 | $907 | $38,046 | $7,148 | $30,898 |
| 2024 | $801 | $32,091 | $7,634 | $24,457 |
| 2023 | $801 | $27,792 | $5,481 | $22,311 |
| 2022 | $665 | $25,614 | $4,925 | $20,689 |
| 2021 | $641 | $23,607 | $4,508 | $19,099 |
| 2020 | $644 | $23,226 | $4,508 | $18,718 |
| 2019 | $621 | $22,395 | $4,508 | $17,887 |
| 2018 | $632 | $22,704 | $4,230 | $18,474 |
| 2017 | $620 | $22,175 | $4,230 | $17,945 |
| 2016 | $536 | $19,903 | $3,122 | $16,781 |
| 2015 | $529 | $19,591 | $3,122 | $16,469 |
| 2014 | $568 | $20,776 | $3,053 | $17,723 |
Source: Public Records
Map
Nearby Homes
- 6206 Harlem Grovetown Rd
- 2125 Lavender Trail
- 0 Appling Harlem Rd Unit 552725
- 170 Ballard Dr
- 1330 Freeman Harriss Rd
- 2110 Shell Point Ct
- 390 Shagbark Way
- 107 Yellow Birch Way Unit 14
- 390 Tupelo Pass
- 385 Shagbark Way
- 1382 Intermediate Rd
- 129 W Trippe St
- 343 Tupelo Pass
- 345 Tupelo Pass
- 347 Tupelo Pass
- 349 Tupelo Pass
- 344 Tupelo Pass
- 351 Tupelo Pass
- 530 Hillcrest
- 423 Chickadee Way
Your Personal Tour Guide
Ask me questions while you tour the home.