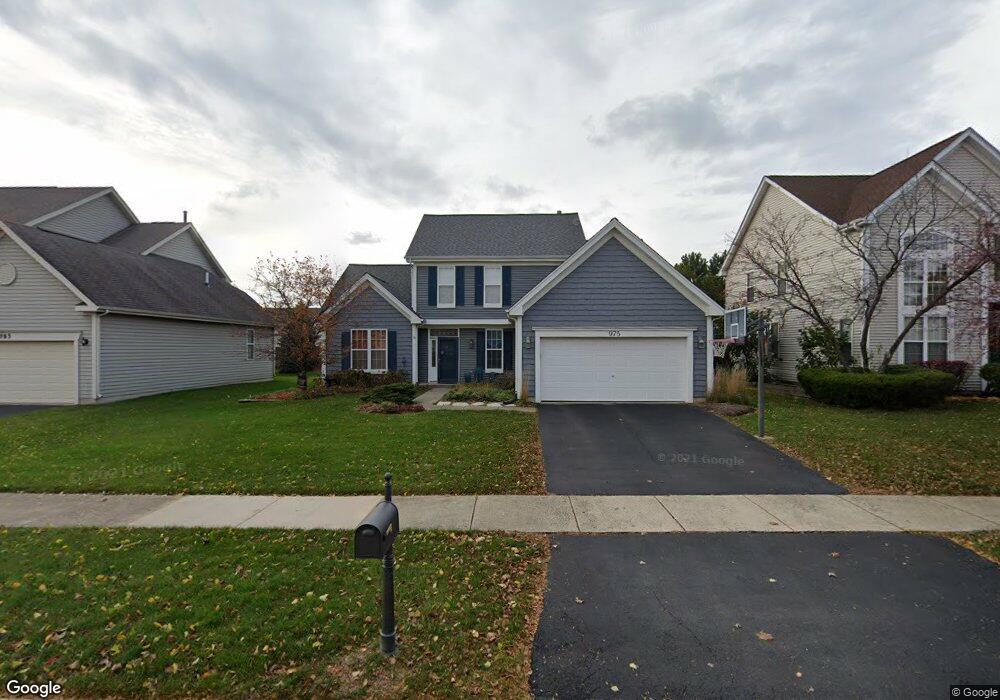
975 Red Clover Dr Unit 2 Aurora, IL 60504
Far East NeighborhoodEstimated Value: $420,000 - $533,000
3
Beds
3
Baths
2,122
Sq Ft
$221/Sq Ft
Est. Value
About This Home
This home is located at 975 Red Clover Dr Unit 2, Aurora, IL 60504 and is currently estimated at $469,983, approximately $221 per square foot. 975 Red Clover Dr Unit 2 is a home located in DuPage County with nearby schools including Owen Elementary School, Mill Street Elementary School, and Still Middle School.
Ownership History
Date
Name
Owned For
Owner Type
Purchase Details
Closed on
Jul 31, 2006
Sold by
Labedz Karen L
Bought by
Labedz Karen L and Karen L Labedz Trust
Current Estimated Value
Purchase Details
Closed on
Mar 10, 2003
Sold by
Klein Donald C and Klein Evelyn
Bought by
Labedz Karen L
Home Financials for this Owner
Home Financials are based on the most recent Mortgage that was taken out on this home.
Original Mortgage
$176,000
Outstanding Balance
$76,104
Interest Rate
5.96%
Estimated Equity
$393,879
Purchase Details
Closed on
Oct 10, 2002
Sold by
Cendant Mobility Government Financial Se
Bought by
Klein Donald C and Klein Evelyn
Purchase Details
Closed on
Sep 20, 2002
Sold by
Ferguson Thomas W and Ferguson Anita L
Bought by
Cendant Mobility Government Financial Se
Purchase Details
Closed on
Apr 3, 1997
Sold by
Wiseman Hughes Enterprises Inc
Bought by
Ferguson Thomas W and Ferguson Anita L
Home Financials for this Owner
Home Financials are based on the most recent Mortgage that was taken out on this home.
Original Mortgage
$122,000
Interest Rate
7.74%
Create a Home Valuation Report for This Property
The Home Valuation Report is an in-depth analysis detailing your home's value as well as a comparison with similar homes in the area
Home Values in the Area
Average Home Value in this Area
Purchase History
| Date | Buyer | Sale Price | Title Company |
|---|---|---|---|
| Labedz Karen L | -- | None Available | |
| Labedz Karen L | $220,000 | First American Title | |
| Klein Donald C | $220,000 | First American Title | |
| Cendant Mobility Government Financial Se | $219,500 | First American Title | |
| Ferguson Thomas W | $151,000 | -- |
Source: Public Records
Mortgage History
| Date | Status | Borrower | Loan Amount |
|---|---|---|---|
| Open | Labedz Karen L | $176,000 | |
| Previous Owner | Ferguson Thomas W | $122,000 |
Source: Public Records
Tax History Compared to Growth
Tax History
| Year | Tax Paid | Tax Assessment Tax Assessment Total Assessment is a certain percentage of the fair market value that is determined by local assessors to be the total taxable value of land and additions on the property. | Land | Improvement |
|---|---|---|---|---|
| 2024 | $9,493 | $132,858 | $32,463 | $100,395 |
| 2023 | $9,052 | $119,380 | $29,170 | $90,210 |
| 2022 | $8,740 | $110,220 | $26,710 | $83,510 |
| 2021 | $8,508 | $106,290 | $25,760 | $80,530 |
| 2020 | $8,612 | $106,290 | $25,760 | $80,530 |
| 2019 | $8,307 | $101,090 | $24,500 | $76,590 |
| 2018 | $8,151 | $98,280 | $23,620 | $74,660 |
| 2017 | $8,014 | $94,950 | $22,820 | $72,130 |
| 2016 | $7,870 | $91,120 | $21,900 | $69,220 |
| 2015 | $7,788 | $86,510 | $20,790 | $65,720 |
| 2014 | $7,356 | $79,830 | $19,040 | $60,790 |
| 2013 | $7,280 | $80,380 | $19,170 | $61,210 |
Source: Public Records
Map
Nearby Homes
- 4105 Winslow Ct
- 4118 Calder Ln
- 4515 Chelsea Manor Cir
- 4511 Chelsea Manor Cir
- Danbury II Plan at Chelsea Manor - Charlestown Series
- Ainslie Plan at Chelsea Manor - Charlestown Series
- 4138 Irving Rd
- 4177 Irving Rd
- 1348 Amaranth Dr
- 4328 Chelsea Manor Cir
- 3437 Charlemaine Dr
- 3467 Charlemaine Dr
- 3901 White Eagle Dr W
- 3479 Charlemaine Dr
- 3473 Ravinia Cir
- 3389 Ravinia Cir
- 4258 Stableford Ln
- 300 Churchill Ln
- 1512 Harbour Towne Place
- 441 Park Ridge Ln Unit C
- 985 Red Clover Dr
- 965 Red Clover Dr
- 955 Red Clover Dr
- 995 Red Clover Dr
- 988 Lakestone Ln Unit 26
- 974 Red Clover Dr
- 994 Lakestone Ln
- 984 Red Clover Dr
- 976 Lakestone Ln
- 964 Red Clover Dr
- 1000 Lakestone Ln
- 945 Red Clover Dr
- 1006 Lakestone Ln
- 970 Lakestone Ln Unit 26
- 994 Red Clover Dr
- 982 Lakestone Ln
- 1005 Red Clover Dr
- 1012 Lakestone Ln Unit 26
- 934 Red Clover Dr
- 1004 Red Clover Dr