Estimated Value: $695,347 - $826,000
5
Beds
4
Baths
2,597
Sq Ft
$298/Sq Ft
Est. Value
About This Home
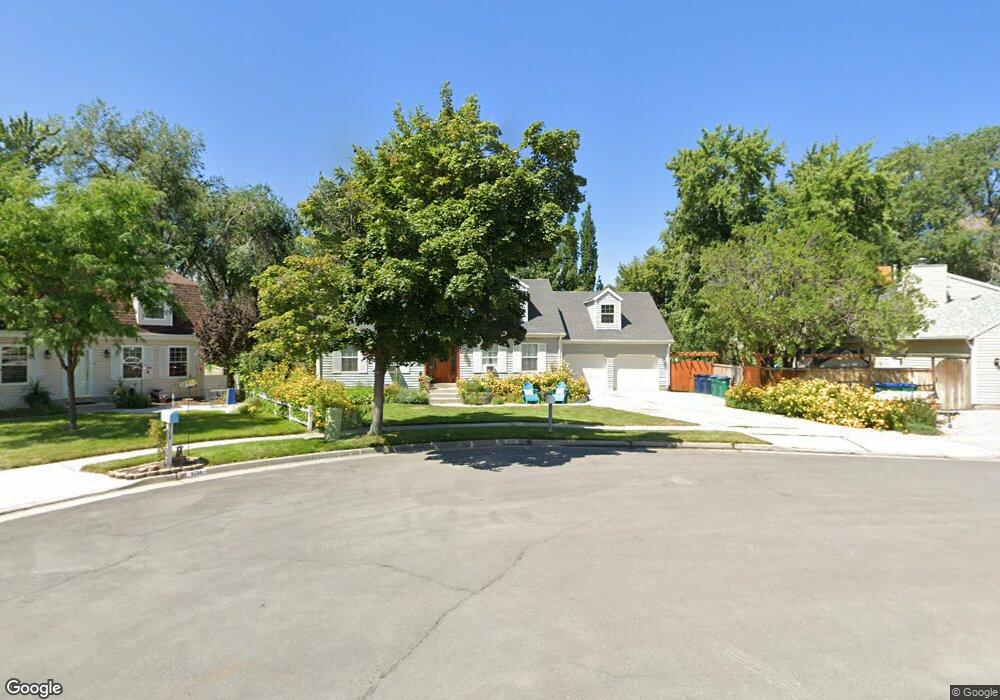
This home is located at 9750 Copplestone Cir, Sandy, UT 84092 and is currently estimated at $774,337, approximately $298 per square foot. 9750 Copplestone Cir is a home located in Salt Lake County with nearby schools including Willow Canyon Elementary School, Eastmont Middle School, and Jordan High.
Ownership History
Date
Name
Owned For
Owner Type
Purchase Details
Closed on
Sep 13, 2005
Sold by
Rondas Maria L
Bought by
Rondas Maria L and Cali Cameron M
Current Estimated Value
Home Financials for this Owner
Home Financials are based on the most recent Mortgage that was taken out on this home.
Original Mortgage
$267,600
Outstanding Balance
$142,356
Interest Rate
5.76%
Mortgage Type
New Conventional
Estimated Equity
$631,981
Purchase Details
Closed on
Dec 18, 2003
Sold by
Cali Cameron M and Rondas Maria L
Bought by
Rondas Maria L
Purchase Details
Closed on
Nov 17, 2003
Sold by
Cali Cameron M
Bought by
Cali Cameron M and Rondas Maria L
Purchase Details
Closed on
Dec 14, 1999
Sold by
Rondas Maria L and Cali Maria L
Bought by
Cali Cameron M
Purchase Details
Closed on
Sep 10, 1998
Sold by
Mcallister Larry C and Mcallister Kathryne P
Bought by
Rondas Maria L
Home Financials for this Owner
Home Financials are based on the most recent Mortgage that was taken out on this home.
Original Mortgage
$207,000
Interest Rate
6.92%
Create a Home Valuation Report for This Property
The Home Valuation Report is an in-depth analysis detailing your home's value as well as a comparison with similar homes in the area
Home Values in the Area
Average Home Value in this Area
Purchase History
| Date | Buyer | Sale Price | Title Company |
|---|---|---|---|
| Rondas Maria L | -- | Canyon View Title Ins Agency | |
| Rondas Maria L | -- | Canyon View Title Ins Agency | |
| Cali Cameron M | -- | Canyon View Title Ins Agency | |
| Cali Cameron M | -- | -- | |
| Rondas Maria L | -- | Superior Title Company |
Source: Public Records
Mortgage History
| Date | Status | Borrower | Loan Amount |
|---|---|---|---|
| Open | Rondas Maria L | $267,600 | |
| Closed | Rondas Maria L | $207,000 |
Source: Public Records
Tax History
| Year | Tax Paid | Tax Assessment Tax Assessment Total Assessment is a certain percentage of the fair market value that is determined by local assessors to be the total taxable value of land and additions on the property. | Land | Improvement |
|---|---|---|---|---|
| 2025 | $3,186 | $618,700 | $240,100 | $378,600 |
| 2024 | $3,186 | $619,500 | $231,100 | $388,400 |
| 2023 | $3,186 | $561,600 | $222,200 | $339,400 |
| 2022 | $3,007 | $566,200 | $217,800 | $348,400 |
| 2021 | $2,892 | $464,100 | $174,200 | $289,900 |
| 2020 | $2,393 | $362,600 | $174,200 | $188,400 |
| 2019 | $2,369 | $350,400 | $164,300 | $186,100 |
| 2018 | $2,126 | $329,700 | $164,300 | $165,400 |
| 2017 | $1,940 | $287,900 | $164,300 | $123,600 |
| 2016 | $1,835 | $263,600 | $148,100 | $115,500 |
| 2015 | $1,697 | $226,000 | $161,400 | $64,600 |
| 2014 | $1,572 | $205,800 | $152,500 | $53,300 |
Source: Public Records
Map
Nearby Homes
- 9828 Pinehurst Dr
- 1584 Petunia Way
- 1563 E Tameron Dr
- 1469 Winterwood Cir
- 9979 S Albury Rd
- 1650 E Budding Dr
- 9472 S Tramway Dr
- 9968 S Blossom Dr
- 1952 E Bluffside Cir
- 1492 E Sandy Hills Dr
- 10158 Buttercup Dr
- 9976 Tamara St E
- 10172 Snow Iris Way
- 9633 S 1210 E
- 10240 Locksley Rd
- 10286 S Edgecliff Dr
- 1602 E Sego Lily Dr
- 1242 Earl Way
- 2163 E Borg Dr
- 2009 E Sweetbriar Ln
- 9750 S Copplestone Cir
- 1656 Ridgemark Dr
- 1656 E Ridgemark Dr
- 9749 Bainbridge Rd
- 9758 Copplestone Cir
- 9759 Bainbridge Rd
- 1630 Ridgemark Dr
- 1630 E Ridgemark Dr
- 9763 S Copplestone Cir
- 9763 Copplestone Cir
- 1612 Bainbridge Rd
- 1612 Bainbridge Rd Unit 222
- 1612 E Bainbridge Rd
- 1670 E Ridgemark Dr
- 1670 Ridgemark Dr
- 1643 E 9800 S
- 9757 S Copplestone Cir
- 1655 E 9800 S
- 9757 Copplestone Cir
- 1631 E 9800 S
Your Personal Tour Guide
Ask me questions while you tour the home.