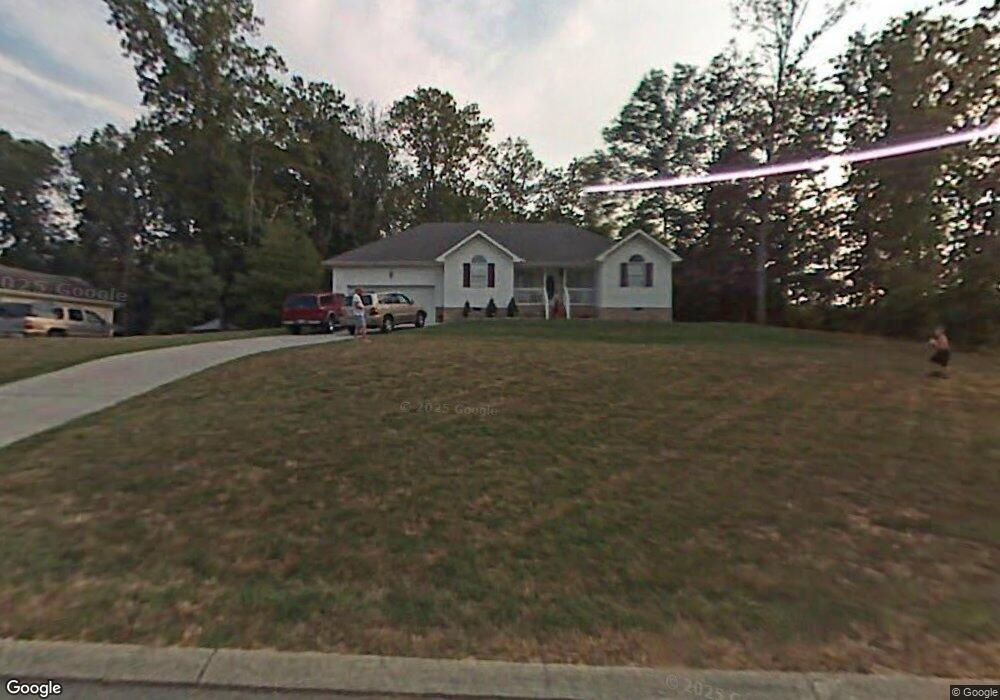
9750 Fielding Rd Ooltewah, TN 37363
Estimated Value: $360,895 - $375,000
3
Beds
2
Baths
1,658
Sq Ft
$221/Sq Ft
Est. Value
About This Home
This home is located at 9750 Fielding Rd, Ooltewah, TN 37363 and is currently estimated at $366,724, approximately $221 per square foot. 9750 Fielding Rd is a home located in Hamilton County with nearby schools including Wallace A. Smith Elementary School, Hunter Middle School, and Central High School.
Ownership History
Date
Name
Owned For
Owner Type
Purchase Details
Closed on
Nov 28, 2006
Sold by
York Richard and York Kacey
Bought by
Collins Ricky J and Collins Melanie E
Current Estimated Value
Home Financials for this Owner
Home Financials are based on the most recent Mortgage that was taken out on this home.
Original Mortgage
$103,675
Outstanding Balance
$60,778
Interest Rate
6.33%
Mortgage Type
Unknown
Estimated Equity
$305,946
Purchase Details
Closed on
Sep 30, 1998
Sold by
Oliver Jerry L and Oliver Terry B
Bought by
York Richard
Home Financials for this Owner
Home Financials are based on the most recent Mortgage that was taken out on this home.
Original Mortgage
$105,600
Interest Rate
6.5%
Purchase Details
Closed on
Jul 1, 1998
Sold by
Bell Development Company Inc
Bought by
Oliver Jerry L and Oliver Terry B
Home Financials for this Owner
Home Financials are based on the most recent Mortgage that was taken out on this home.
Original Mortgage
$81,200
Interest Rate
7.1%
Create a Home Valuation Report for This Property
The Home Valuation Report is an in-depth analysis detailing your home's value as well as a comparison with similar homes in the area
Home Values in the Area
Average Home Value in this Area
Purchase History
| Date | Buyer | Sale Price | Title Company |
|---|---|---|---|
| Collins Ricky J | $159,500 | First Title | |
| York Richard | $122,000 | -- | |
| Oliver Jerry L | $18,000 | -- |
Source: Public Records
Mortgage History
| Date | Status | Borrower | Loan Amount |
|---|---|---|---|
| Open | Collins Ricky J | $103,675 | |
| Previous Owner | York Richard | $105,600 | |
| Previous Owner | Oliver Jerry L | $81,200 |
Source: Public Records
Tax History
| Year | Tax Paid | Tax Assessment Tax Assessment Total Assessment is a certain percentage of the fair market value that is determined by local assessors to be the total taxable value of land and additions on the property. | Land | Improvement |
|---|---|---|---|---|
| 2025 | $1,286 | $84,825 | $0 | $0 |
| 2024 | $1,242 | $55,500 | $0 | $0 |
| 2023 | $1,251 | $55,500 | $0 | $0 |
| 2022 | $1,251 | $55,500 | $0 | $0 |
| 2021 | $1,251 | $55,500 | $0 | $0 |
| 2020 | $1,233 | $44,275 | $0 | $0 |
| 2019 | $1,233 | $44,275 | $0 | $0 |
| 2018 | $1,233 | $44,275 | $0 | $0 |
| 2017 | $1,233 | $44,275 | $0 | $0 |
| 2016 | $1,120 | $0 | $0 | $0 |
| 2015 | $1,120 | $40,175 | $0 | $0 |
| 2014 | $1,120 | $0 | $0 | $0 |
Source: Public Records
Map
Nearby Homes
- 6601 Flagstone Dr
- 7115 Snapdragon Ln
- 10564 Fielding Rd
- 6015 Parsons Pond Dr
- 6920 Knollcrest Dr
- 7050 Luke Ln
- 6831 Knollcrest Dr
- 4110 Flagway Dr
- 6110 Hunter Crest Dr
- 7118 Flagstone Dr
- 7215 Flagstone Dr
- 8082 Zoe Dr
- 8121 Zoe Dr
- 5311 Kellys Point
- 5312 Kellys Point
- 0 Lodestone Dr
- 7298 Flagridge Dr
- 6895 Bucksland Dr
- 6898 Bucksland Dr
- 7356 Landlock Dr
- 9774 Fielding Rd
- 5963 Chandler Hill Rd
- 5919 Chandler Hill Rd
- 9751 Fielding Rd
- 5903 Chandler Hill Rd
- 5903 Chandler Hill Rd Unit 523
- 9818 Fielding Rd
- 9773 Fielding Rd
- 6009 Chandler Hill Rd
- 5950 Chandler Hill Rd
- 5950 Chandler Hill Rd Unit 316
- 9892 Fielding Rd
- 9674 Vernon Hill Dr
- 9667 Vernon Hill Dr
- 5988 Chandler Hill Rd
- 9926 Fielding Rd
- 9926 Fielding Rd Unit 523
- 6537 Sawtooth Dr
- 6520 Sawtooth Dr
- 9942 Fielding Rd
Your Personal Tour Guide
Ask me questions while you tour the home.