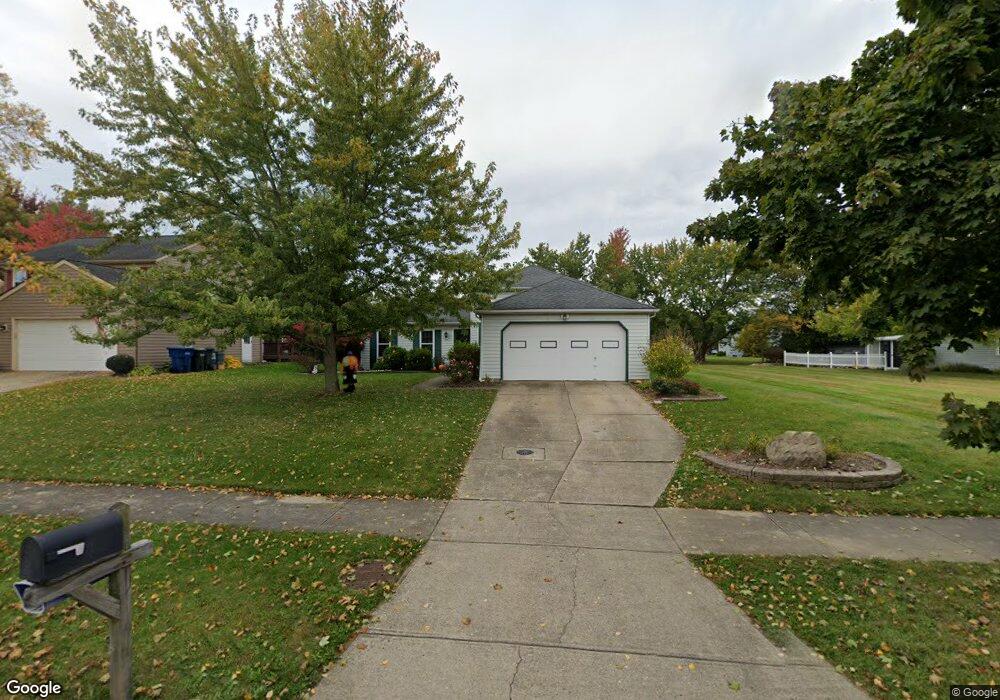
9752 Tannery Way Olmsted Falls, OH 44138
Estimated Value: $286,000 - $339,000
3
Beds
2
Baths
1,760
Sq Ft
$172/Sq Ft
Est. Value
About This Home
This home is located at 9752 Tannery Way, Olmsted Falls, OH 44138 and is currently estimated at $303,485, approximately $172 per square foot. 9752 Tannery Way is a home located in Cuyahoga County with nearby schools including Falls-Lenox Primary Elementary School, Olmsted Falls Intermediate Building, and Olmsted Falls Middle School.
Ownership History
Date
Name
Owned For
Owner Type
Purchase Details
Closed on
Jun 29, 1999
Sold by
Acosta Waldo A and Acosta Eileen F
Bought by
Kovach Michael E and Kovach Sharon J
Current Estimated Value
Home Financials for this Owner
Home Financials are based on the most recent Mortgage that was taken out on this home.
Original Mortgage
$122,400
Outstanding Balance
$33,554
Interest Rate
7.29%
Estimated Equity
$269,931
Purchase Details
Closed on
Jun 11, 1986
Bought by
Acosta Waldo A
Purchase Details
Closed on
Jun 27, 1985
Bought by
Shore West Const Co
Purchase Details
Closed on
Dec 31, 1984
Bought by
Transohio Service Corp
Purchase Details
Closed on
Jan 1, 1979
Bought by
Kjp Inc
Create a Home Valuation Report for This Property
The Home Valuation Report is an in-depth analysis detailing your home's value as well as a comparison with similar homes in the area
Home Values in the Area
Average Home Value in this Area
Purchase History
| Date | Buyer | Sale Price | Title Company |
|---|---|---|---|
| Kovach Michael E | $136,500 | Midland Title Security Inc | |
| Acosta Waldo A | $82,900 | -- | |
| Shore West Const Co | -- | -- | |
| Transohio Service Corp | -- | -- | |
| Kjp Inc | -- | -- |
Source: Public Records
Mortgage History
| Date | Status | Borrower | Loan Amount |
|---|---|---|---|
| Open | Kovach Michael E | $122,400 |
Source: Public Records
Tax History Compared to Growth
Tax History
| Year | Tax Paid | Tax Assessment Tax Assessment Total Assessment is a certain percentage of the fair market value that is determined by local assessors to be the total taxable value of land and additions on the property. | Land | Improvement |
|---|---|---|---|---|
| 2024 | $5,610 | $85,855 | $17,605 | $68,250 |
| 2023 | $5,293 | $66,400 | $16,240 | $50,160 |
| 2022 | $5,250 | $66,400 | $16,240 | $50,160 |
| 2021 | $5,198 | $66,400 | $16,240 | $50,160 |
| 2020 | $5,130 | $58,240 | $14,250 | $44,000 |
| 2019 | $4,554 | $166,400 | $40,700 | $125,700 |
| 2018 | $4,547 | $58,240 | $14,250 | $44,000 |
| 2017 | $4,338 | $51,210 | $11,030 | $40,180 |
| 2016 | $4,316 | $51,210 | $11,030 | $40,180 |
| 2015 | $4,180 | $51,210 | $11,030 | $40,180 |
| 2014 | $4,180 | $48,310 | $10,400 | $37,910 |
Source: Public Records
Map
Nearby Homes
- 23390 Wainwright Terrace
- 23514 Grist Mill Ct Unit 4
- 9797 Sugarbush Cir
- 23155 Wainwright Terrace
- 9855 Dupont Dr
- V/L Aldridge Dr
- 23002 Chandlers Ln
- 23002 Chandlers Ln Unit 342
- 23002 Chandlers Ln Unit 221
- 23003 Chandlers Ln Unit 219
- 23003 Chandlers Ln Unit 230
- 549 Wyleswood Dr
- 537 Wyleswood Dr
- 543 Wyleswood Dr
- 8809 Leatherleaf Dr
- 647 Tampico Ct Unit 7
- 458 Sprague Rd
- 8896 Firethorne Dr
- 24628 Sprague Rd
- 8960 Leatherleaf Dr
- 9756 Tannery Way
- 9744 Tannery Way
- 23714 Sawmill Bend
- 23710 Sawmill Bend
- 23706 Sawmill Bend
- 9740 Tannery Way
- 9764 Tannery Way
- 9747 Tannery Way
- 9751 Tannery Way
- 9743 Tannery Way
- 23722 Sawmill Bend
- 23702 Sawmill Bend
- 9755 Tannery Way
- 9736 Tannery Way
- 9739 Tannery Way
- 23698 Sawmill Bend
- 9768 Tannery Way
- 9759 Tannery Way
- 9735 Tannery Way
- 9732 Tannery Way