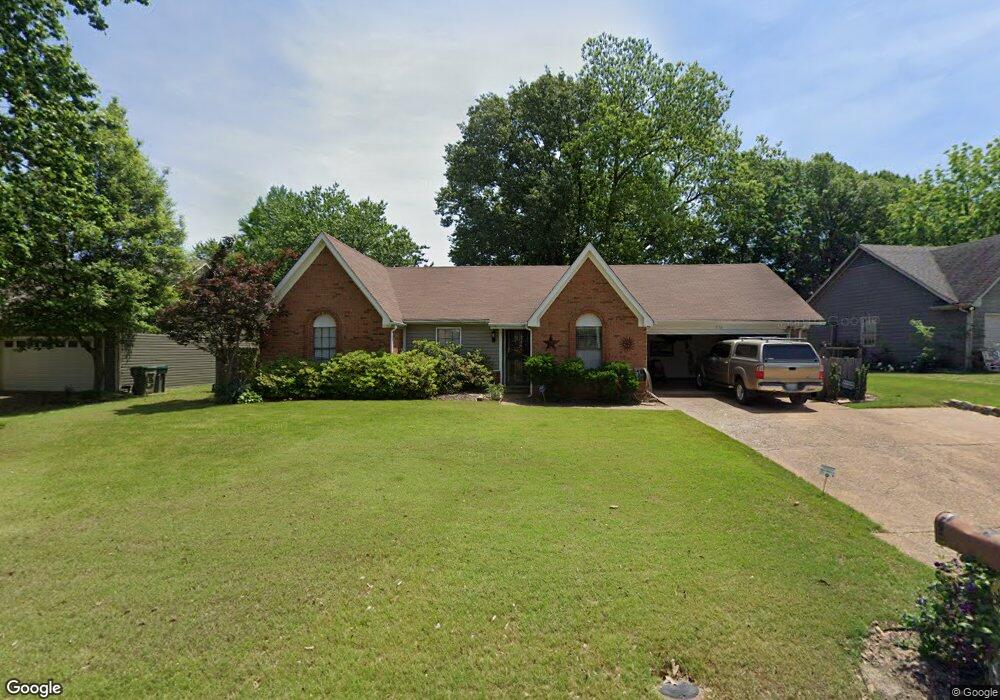
976 Boones Hollow Cove Cordova, TN 38018
Cordova NeighborhoodEstimated Value: $241,000 - $257,000
3
Beds
2
Baths
1,756
Sq Ft
$141/Sq Ft
Est. Value
About This Home
This home is located at 976 Boones Hollow Cove, Cordova, TN 38018 and is currently estimated at $246,854, approximately $140 per square foot. 976 Boones Hollow Cove is a home located in Shelby County with nearby schools including Cordova Elementary School, Cordova Middle School, and Cordova High School.
Ownership History
Date
Name
Owned For
Owner Type
Purchase Details
Closed on
Mar 1, 2005
Sold by
Cendant Mobility Financial Corp
Bought by
Fox James L
Current Estimated Value
Home Financials for this Owner
Home Financials are based on the most recent Mortgage that was taken out on this home.
Original Mortgage
$125,012
Outstanding Balance
$62,490
Interest Rate
5.6%
Mortgage Type
FHA
Estimated Equity
$184,364
Purchase Details
Closed on
Dec 1, 2004
Sold by
Lubitz Eric P
Bought by
Cendant Mobility Financial Corp and Burrow Closing Management Corp
Purchase Details
Closed on
Aug 30, 1996
Sold by
Sanders Harry D and Sanders Stacey M
Bought by
Lubitz Eric P
Home Financials for this Owner
Home Financials are based on the most recent Mortgage that was taken out on this home.
Original Mortgage
$93,200
Interest Rate
8.21%
Mortgage Type
Balloon
Create a Home Valuation Report for This Property
The Home Valuation Report is an in-depth analysis detailing your home's value as well as a comparison with similar homes in the area
Home Values in the Area
Average Home Value in this Area
Purchase History
| Date | Buyer | Sale Price | Title Company |
|---|---|---|---|
| Fox James L | $126,000 | Realty Title & Escrow Co | |
| Cendant Mobility Financial Corp | $132,500 | -- | |
| Lubitz Eric P | $116,500 | -- | |
| Lubitz Eric P | $116,500 | -- |
Source: Public Records
Mortgage History
| Date | Status | Borrower | Loan Amount |
|---|---|---|---|
| Open | Fox James L | $125,012 | |
| Previous Owner | Lubitz Eric P | $93,200 |
Source: Public Records
Tax History Compared to Growth
Tax History
| Year | Tax Paid | Tax Assessment Tax Assessment Total Assessment is a certain percentage of the fair market value that is determined by local assessors to be the total taxable value of land and additions on the property. | Land | Improvement |
|---|---|---|---|---|
| 2025 | $1,599 | $61,175 | $13,750 | $47,425 |
| 2024 | $1,599 | $47,175 | $7,500 | $39,675 |
| 2023 | $2,874 | $47,175 | $7,500 | $39,675 |
| 2022 | $2,874 | $47,175 | $7,500 | $39,675 |
| 2021 | $2,907 | $47,175 | $7,500 | $39,675 |
| 2020 | $2,398 | $33,100 | $7,500 | $25,600 |
| 2019 | $2,398 | $33,100 | $7,500 | $25,600 |
| 2018 | $2,398 | $33,100 | $7,500 | $25,600 |
| 2017 | $1,360 | $33,100 | $7,500 | $25,600 |
| 2016 | $1,197 | $27,400 | $0 | $0 |
| 2014 | $1,197 | $27,400 | $0 | $0 |
Source: Public Records
Map
Nearby Homes
- 1012 Hunters Point Dr
- 7926 Macon Rd
- 956 Spinnaker Ln
- 1164 Brady Hollow Ln
- 1102 Mirror Lake Ln
- 7871 Brady Creek Cove
- 1218 Cordova Green Dr
- 8143 Timber Knoll Ln
- 7494 Links View Ln S
- 901 Timber Grove Dr
- 1311 Fox Trace Dr
- 7468 Links View Ln S
- 887 Dalemore Ln
- 878 Timber Grove Dr
- 1089 Links View Ln W
- 731 Walnut Woods Cove N
- 948 Waif Woods Cove
- 914 Waif Woods Ln
- 7420 Dal Whinnie Trail
- 8170 Wood Moss Cove
- 986 Boones Hollow Cove
- 968 Boones Hollow Cove
- 975 Hunters Point Dr
- 992 Boones Hollow Cove
- 965 Hunters Point Dr
- 958 Boones Hollow Cove
- 965 Hunters Point
- 983 Hunters Point Dr
- 979 Boones Hollow Cove
- 973 Boones Hollow Cove
- 987 Boones Hollow Cove
- 957 Hunters Point Dr
- 965 Boones Hollow Cove
- 1000 Boones Hollow Dr
- 991 Hunters Point Dr
- 993 Boones Hollow Cove
- 954 Boones Hollow Cove
- 949 Hunters Point Dr
- 955 Boones Hollow Cove
- 7771 Grouse Hollow Cove