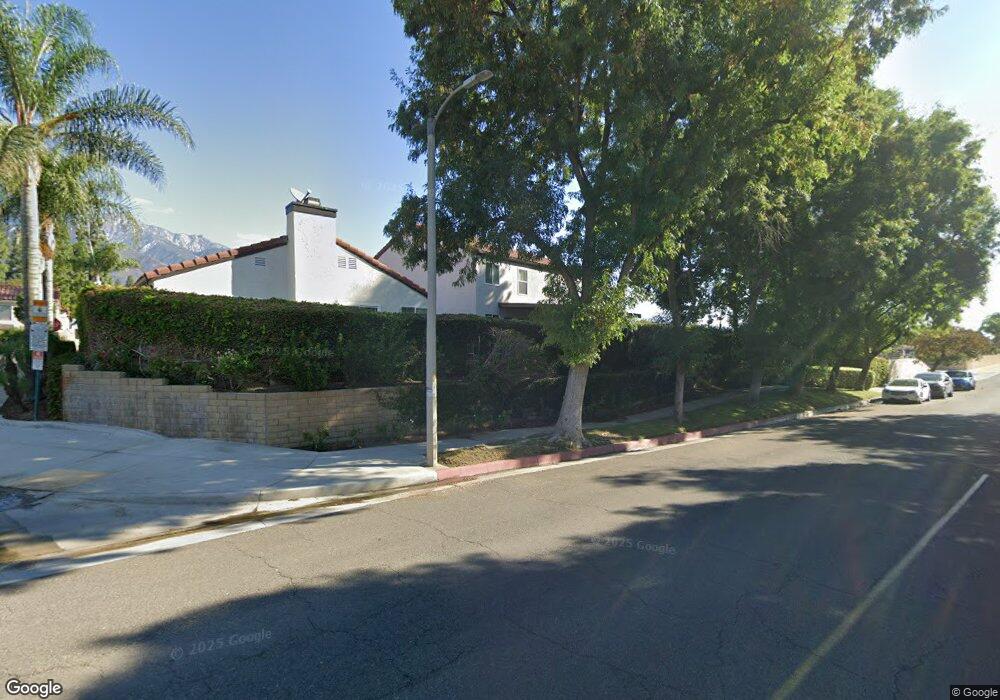
9761 Pleasant View Dr Rancho Cucamonga, CA 91701
Estimated Value: $685,000 - $744,000
4
Beds
3
Baths
1,516
Sq Ft
$471/Sq Ft
Est. Value
About This Home
This home is located at 9761 Pleasant View Dr, Rancho Cucamonga, CA 91701 and is currently estimated at $714,588, approximately $471 per square foot. 9761 Pleasant View Dr is a home located in San Bernardino County with nearby schools including Alta Loma Elementary, Alta Loma Junior High, and Alta Loma High.
Ownership History
Date
Name
Owned For
Owner Type
Purchase Details
Closed on
Nov 13, 2002
Sold by
Armour Richard L
Bought by
Castaneda Francisco A and Castaneda Luz
Current Estimated Value
Home Financials for this Owner
Home Financials are based on the most recent Mortgage that was taken out on this home.
Original Mortgage
$237,000
Interest Rate
6.12%
Purchase Details
Closed on
Mar 7, 1997
Sold by
Park Douglas Dongwon and Park Joanne Jaekyung
Bought by
Armour Richard L
Home Financials for this Owner
Home Financials are based on the most recent Mortgage that was taken out on this home.
Original Mortgage
$128,717
Interest Rate
7.56%
Mortgage Type
FHA
Create a Home Valuation Report for This Property
The Home Valuation Report is an in-depth analysis detailing your home's value as well as a comparison with similar homes in the area
Home Values in the Area
Average Home Value in this Area
Purchase History
| Date | Buyer | Sale Price | Title Company |
|---|---|---|---|
| Castaneda Francisco A | $238,000 | Orange Coast Title | |
| Armour Richard L | $130,000 | Chicago Title Co |
Source: Public Records
Mortgage History
| Date | Status | Borrower | Loan Amount |
|---|---|---|---|
| Previous Owner | Castaneda Francisco A | $237,000 | |
| Previous Owner | Armour Richard L | $128,717 |
Source: Public Records
Tax History Compared to Growth
Tax History
| Year | Tax Paid | Tax Assessment Tax Assessment Total Assessment is a certain percentage of the fair market value that is determined by local assessors to be the total taxable value of land and additions on the property. | Land | Improvement |
|---|---|---|---|---|
| 2025 | $3,738 | $344,704 | $86,175 | $258,529 |
| 2024 | $3,738 | $337,945 | $84,485 | $253,460 |
| 2023 | $3,655 | $331,318 | $82,828 | $248,490 |
| 2022 | $3,644 | $324,822 | $81,204 | $243,618 |
| 2021 | $3,641 | $318,453 | $79,612 | $238,841 |
| 2020 | $3,494 | $315,188 | $78,796 | $236,392 |
| 2019 | $3,531 | $309,008 | $77,251 | $231,757 |
| 2018 | $3,452 | $302,949 | $75,736 | $227,213 |
| 2017 | $3,297 | $297,009 | $74,251 | $222,758 |
| 2016 | $3,208 | $291,185 | $72,795 | $218,390 |
| 2015 | $3,187 | $286,812 | $71,702 | $215,110 |
| 2014 | $3,098 | $281,193 | $70,297 | $210,896 |
Source: Public Records
Map
Nearby Homes
- 6949 Laguna Place Unit B1
- 9740 Woodleaf Dr
- 6946 Archibald Ave
- 6880 Archibald Ave Unit 114
- 6880 Archibald Ave Unit 27
- 6880 Archibald Ave Unit 40
- 6880 Archibald Ave Unit 43
- 7018 Princeton Place
- 6740 London Ave
- 6765 Jadeite Ave
- 9800 Baseline Rd Unit 76
- 9800 Baseline Rd Unit 71
- 9800 Baseline Rd Unit 17
- 9800 Baseline Rd Unit 82
- 9800 Baseline Rd Unit 62
- 10040 Jonquil Dr
- 6715 Meriwether Ct
- 9757 Balaton St
- 9800 Base Line Rd Unit 79
- 6600 Montresor Place
- 9767 Pleasant View Dr
- 9755 Pleasant View Dr
- 6869 Shadow Ridge Place
- 6861 Shadow Ridge Place
- 6892 London Ave
- 9737 Pleasant View Dr
- 6882 London Ave
- 6862 Shadow Ridge Place
- 9754 Huntington Dr Unit D
- 9754 Huntington Dr Unit B1
- 9754 Huntington Dr Unit B2
- 9754 Huntington Dr Unit A
- 9731 Pleasant View Dr
- 6872 London Ave
- 9746 Huntington Dr Unit D
- 9746 Huntington Dr
- 9746 Huntington Dr Unit B1
- 9746 Huntington Dr Unit B2
- 9746 Huntington Dr Unit C
- 9746 Huntington Dr Unit A