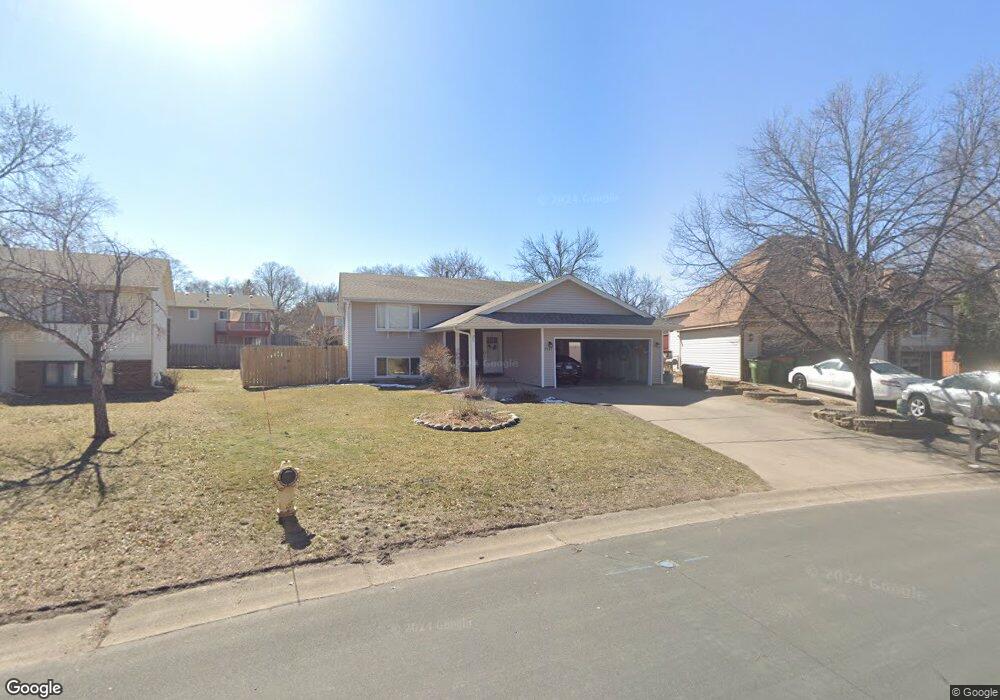
9767 Juniper St NW Coon Rapids, MN 55433
Estimated Value: $338,252 - $370,000
3
Beds
2
Baths
972
Sq Ft
$365/Sq Ft
Est. Value
About This Home
This home is located at 9767 Juniper St NW, Coon Rapids, MN 55433 and is currently estimated at $355,063, approximately $365 per square foot. 9767 Juniper St NW is a home located in Anoka County with nearby schools including Adams Elementary School, Coon Rapids Middle School, and Coon Rapids Senior High School.
Ownership History
Date
Name
Owned For
Owner Type
Purchase Details
Closed on
Sep 30, 2016
Sold by
Young Derek and Young Amanda
Bought by
Sandquist Timothy S and Sandquist Jodi K
Current Estimated Value
Home Financials for this Owner
Home Financials are based on the most recent Mortgage that was taken out on this home.
Original Mortgage
$208,453
Outstanding Balance
$166,955
Interest Rate
3.43%
Mortgage Type
New Conventional
Estimated Equity
$188,108
Purchase Details
Closed on
Dec 21, 2010
Sold by
Secretary Of Housing & Urban Development
Bought by
Harmon Amanda Kay
Home Financials for this Owner
Home Financials are based on the most recent Mortgage that was taken out on this home.
Original Mortgage
$131,100
Interest Rate
4.5%
Mortgage Type
FHA
Purchase Details
Closed on
May 8, 1996
Sold by
Schmolke Theodor
Bought by
Hall Patrick L and Hall Patricia L
Create a Home Valuation Report for This Property
The Home Valuation Report is an in-depth analysis detailing your home's value as well as a comparison with similar homes in the area
Home Values in the Area
Average Home Value in this Area
Purchase History
| Date | Buyer | Sale Price | Title Company |
|---|---|---|---|
| Sandquist Timothy S | $214,900 | Title Specialists Inc | |
| Sandquist Timothy S | $214,900 | Titlesmart Inc | |
| Harmon Amanda Kay | $120,000 | -- | |
| Hall Patrick L | $106,000 | -- |
Source: Public Records
Mortgage History
| Date | Status | Borrower | Loan Amount |
|---|---|---|---|
| Open | Sandquist Timothy S | $208,453 | |
| Previous Owner | Harmon Amanda Kay | $131,100 | |
| Closed | Hall Patrick L | -- |
Source: Public Records
Tax History Compared to Growth
Tax History
| Year | Tax Paid | Tax Assessment Tax Assessment Total Assessment is a certain percentage of the fair market value that is determined by local assessors to be the total taxable value of land and additions on the property. | Land | Improvement |
|---|---|---|---|---|
| 2025 | $3,010 | $302,800 | $80,800 | $222,000 |
| 2024 | $3,010 | $293,300 | $81,000 | $212,300 |
| 2023 | $2,847 | $294,500 | $70,000 | $224,500 |
| 2022 | $2,592 | $294,600 | $62,000 | $232,600 |
| 2021 | $2,442 | $241,700 | $63,000 | $178,700 |
| 2020 | $2,693 | $224,100 | $50,000 | $174,100 |
| 2019 | $2,514 | $235,100 | $60,000 | $175,100 |
| 2018 | $2,369 | $215,000 | $0 | $0 |
| 2017 | $2,061 | $198,200 | $0 | $0 |
| 2016 | $2,139 | $165,000 | $0 | $0 |
| 2015 | $2,064 | $165,000 | $42,000 | $123,000 |
| 2014 | -- | $138,800 | $30,000 | $108,800 |
Source: Public Records
Map
Nearby Homes
- 9800 Ilex St NW
- 420 97th Ave NW
- 9887 Ilex St NW
- 9931 Larch St NW
- 9775 Olive St NW
- 811 98th Ave NW Unit 101
- 9860 Palm St NW
- 844 Coon Rapids Boulevard Extension NW
- 854 Coon Rapids Boulevard Extension NW
- 862 Coon Rapids Boulevard Extension NW
- XXX Holly St NW
- 1005 Coon Rapids Boulevard Extension NW
- 484 104th Ln NW
- 10170 Tamarack St NW
- 10419 Goldenrod St NW
- 10478 Quince St NW
- 10260 3rd St NE Unit D
- 9872 7th St NE
- 1325 97th Ave NW
- 424 106th Ave NW
- 9765 Juniper St NW
- 9769 Juniper St NW
- 9771 Juniper St NW
- 9764 Larch St NW
- 9772 Ilex St NW
- 9766 Juniper St NW
- 9780 Ilex St NW
- 9766 Ilex St NW
- 9786 Ilex St NW
- 9775 Larch St NW
- 9768 Larch St NW
- 9772 Juniper St NW
- 9760 Ilex St NW
- 9748 Ilex St NW
- 9743 Magnolia St NW
- 9772 Larch St NW
- 9749 Magnolia St NW
- 9779 Larch St NW
- 9755 Magnolia St NW
- 9779 Ilex St NW