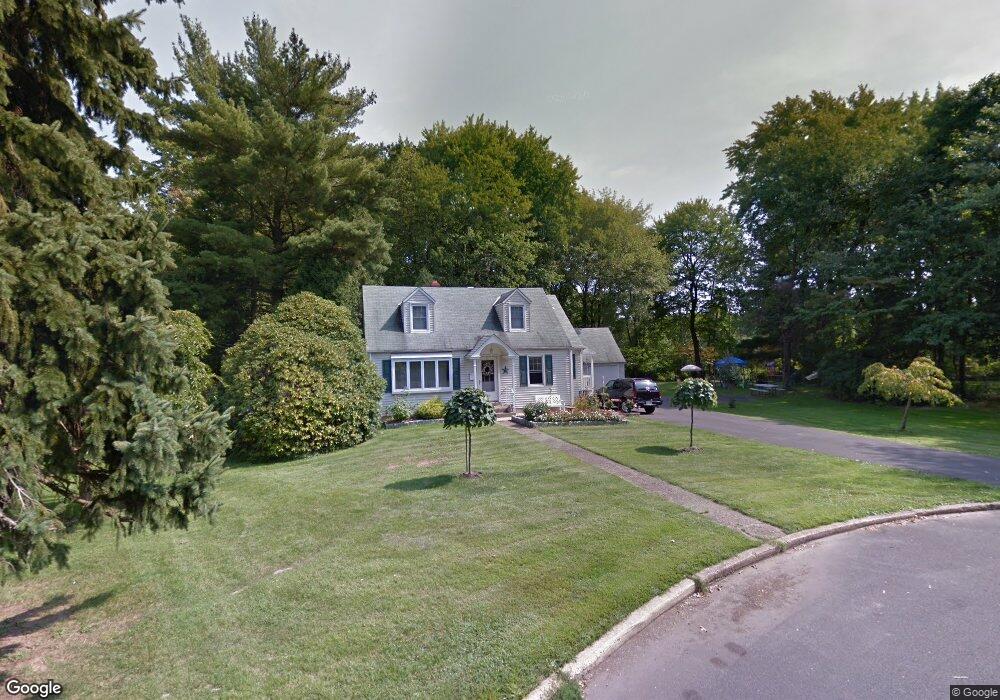
977 Cherry Ln Southampton, PA 18966
Estimated Value: $458,000 - $524,000
4
Beds
2
Baths
1,874
Sq Ft
$263/Sq Ft
Est. Value
About This Home
This home is located at 977 Cherry Ln, Southampton, PA 18966 and is currently estimated at $492,427, approximately $262 per square foot. 977 Cherry Ln is a home located in Bucks County with nearby schools including Davis Elementary School, Klinger Middle School, and William Tennent High School.
Ownership History
Date
Name
Owned For
Owner Type
Purchase Details
Closed on
Oct 28, 2024
Sold by
Maye David Brian and Maye Bernadette M
Bought by
Maye David B
Current Estimated Value
Home Financials for this Owner
Home Financials are based on the most recent Mortgage that was taken out on this home.
Original Mortgage
$130,100
Outstanding Balance
$128,190
Interest Rate
6.08%
Mortgage Type
Credit Line Revolving
Estimated Equity
$364,237
Purchase Details
Closed on
Mar 17, 2017
Sold by
Maye Helen A
Bought by
Maye David Brain and Maye Bernadette M
Purchase Details
Closed on
Oct 9, 1997
Sold by
Brown Laura F
Bought by
Maye Francis M and Maye Helen A
Purchase Details
Closed on
Dec 17, 1951
Bought by
Brown David C and Brown Laura F
Create a Home Valuation Report for This Property
The Home Valuation Report is an in-depth analysis detailing your home's value as well as a comparison with similar homes in the area
Home Values in the Area
Average Home Value in this Area
Purchase History
| Date | Buyer | Sale Price | Title Company |
|---|---|---|---|
| Maye David B | -- | None Listed On Document | |
| Maye David Brain | -- | Nesbaminy Abstract Llc | |
| Maye Francis M | $125,000 | -- | |
| Brown David C | -- | -- |
Source: Public Records
Mortgage History
| Date | Status | Borrower | Loan Amount |
|---|---|---|---|
| Open | Maye David B | $130,100 |
Source: Public Records
Tax History Compared to Growth
Tax History
| Year | Tax Paid | Tax Assessment Tax Assessment Total Assessment is a certain percentage of the fair market value that is determined by local assessors to be the total taxable value of land and additions on the property. | Land | Improvement |
|---|---|---|---|---|
| 2025 | $5,760 | $26,930 | $8,120 | $18,810 |
| 2024 | $5,760 | $26,930 | $8,120 | $18,810 |
| 2023 | $5,585 | $26,930 | $8,120 | $18,810 |
| 2022 | $5,467 | $26,930 | $8,120 | $18,810 |
| 2021 | $5,369 | $26,930 | $8,120 | $18,810 |
| 2020 | $5,294 | $26,930 | $8,120 | $18,810 |
| 2019 | $5,099 | $26,930 | $8,120 | $18,810 |
| 2018 | $4,982 | $26,930 | $8,120 | $18,810 |
| 2017 | $4,841 | $26,930 | $8,120 | $18,810 |
| 2016 | $4,841 | $26,930 | $8,120 | $18,810 |
| 2015 | -- | $26,930 | $8,120 | $18,810 |
| 2014 | -- | $26,930 | $8,120 | $18,810 |
Source: Public Records
Map
Nearby Homes
- 1081 Cherry Ln
- 926 Carlin Dr
- 909 Carlin Dr
- 756 Churchville Rd
- 736 Plum St
- 559 Maple Ave
- 604 Cushmore Rd
- 1307 Steamboat Station Unit 1307
- 435 Temple Rd
- 419 Temple Rd
- 603 Steamboat Station Unit 603
- 615 Belmont Ave
- 1238 Hiview Dr
- 1244 Hiview Dr
- 19 Belmont Station
- 206 E Hampton Crossing
- 967 Jeffrey Dr
- 1370 Mill Creek Rd
- 561 Zinn Dr
- 634 Nicole Dr