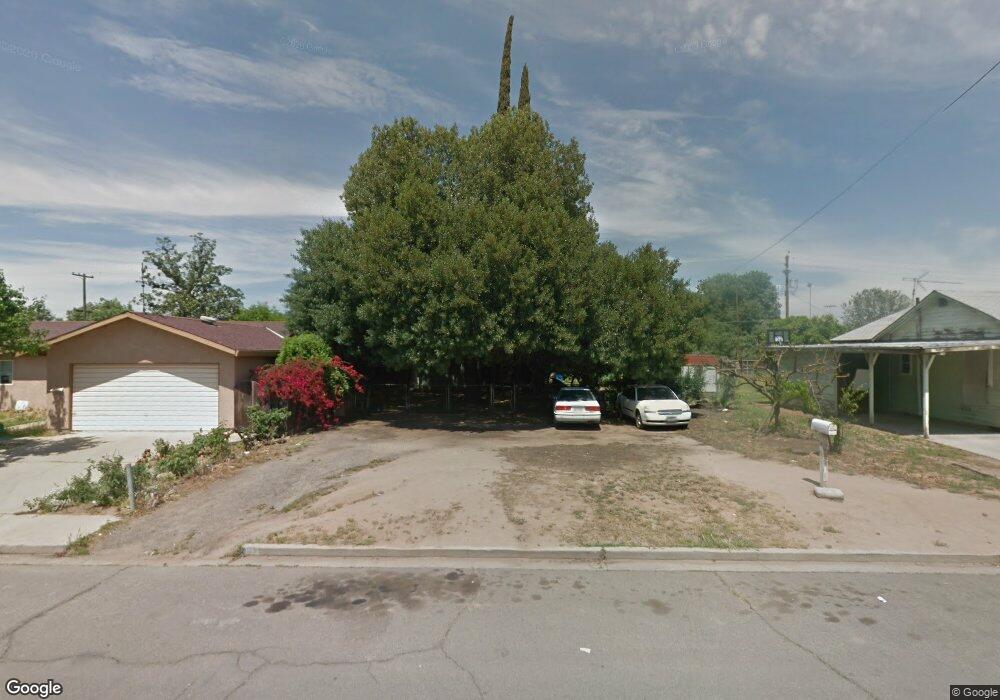
977 E Whittaker Way Dinuba, CA 93618
Estimated Value: $230,000 - $316,000
3
Beds
2
Baths
1,092
Sq Ft
$263/Sq Ft
Est. Value
About This Home
This home is located at 977 E Whittaker Way, Dinuba, CA 93618 and is currently estimated at $286,766, approximately $262 per square foot. 977 E Whittaker Way is a home located in Tulare County with nearby schools including Jefferson Elementary School, Washington Intermediate School, and Dinuba High School.
Ownership History
Date
Name
Owned For
Owner Type
Purchase Details
Closed on
Dec 9, 2024
Sold by
Wendy Carlos V and Wendy Fairchild
Bought by
Garcia Carlos V and Kesting Daniel
Current Estimated Value
Purchase Details
Closed on
Dec 6, 2024
Sold by
Garcia Carlos V and Kesting Daniel
Bought by
Garza Delissa
Purchase Details
Closed on
Oct 17, 2024
Sold by
Garcia Carlos V and Fairchild Wendy
Bought by
Garcia Carlos V
Purchase Details
Closed on
Oct 6, 2016
Sold by
Kesting Annabelle
Bought by
Kesting Daniel
Purchase Details
Closed on
Jun 7, 2015
Sold by
Garcia Carlos V
Bought by
Garcia Carlos and Garcia Wendy Fairchild
Purchase Details
Closed on
Jul 15, 1999
Sold by
Garcia Elpidio S and Garcia Maria M V
Bought by
Garcia Carlos and Kesting Annabelle
Create a Home Valuation Report for This Property
The Home Valuation Report is an in-depth analysis detailing your home's value as well as a comparison with similar homes in the area
Home Values in the Area
Average Home Value in this Area
Purchase History
| Date | Buyer | Sale Price | Title Company |
|---|---|---|---|
| Garcia Carlos V | -- | Placer Title Company | |
| Garcia Carlos V | -- | Placer Title Company | |
| Garza Delissa | $230,000 | Placer Title Company | |
| Garza Delissa | $230,000 | Placer Title Company | |
| Garcia Carlos V | -- | None Listed On Document | |
| Kesting Daniel | -- | None Available | |
| Garcia Carlos | -- | None Available | |
| Garcia Carlos | -- | -- |
Source: Public Records
Tax History
| Year | Tax Paid | Tax Assessment Tax Assessment Total Assessment is a certain percentage of the fair market value that is determined by local assessors to be the total taxable value of land and additions on the property. | Land | Improvement |
|---|---|---|---|---|
| 2025 | $1,077 | $230,000 | $60,000 | $170,000 |
| 2024 | $1,077 | $95,725 | $29,114 | $66,611 |
| 2023 | $1,072 | $93,849 | $28,544 | $65,305 |
| 2022 | $1,015 | $92,010 | $27,985 | $64,025 |
| 2021 | $997 | $90,206 | $27,436 | $62,770 |
| 2020 | $1,000 | $89,281 | $27,155 | $62,126 |
| 2019 | $1,028 | $87,531 | $26,623 | $60,908 |
| 2018 | $981 | $85,815 | $26,101 | $59,714 |
| 2017 | $990 | $84,132 | $25,589 | $58,543 |
| 2016 | $715 | $63,411 | $14,626 | $48,785 |
| 2015 | -- | $62,458 | $14,406 | $48,052 |
| 2014 | -- | $61,235 | $14,124 | $47,111 |
Source: Public Records
Map
Nearby Homes
- 1166 E Park Way
- 65745 Big Meadows Rd
- 520 E Yale Ave
- 225 W Tulare St
- 277 N H St
- 200 N Uruapan Way
- 638 W Kern St
- 340 N K St
- 333 N L St
- 636 W Kern St
- 0 S Alta Ave
- 2072 E Olive Way
- 1702 Bolinger Way
- 201 Bryan Ave
- 1708 Bolinger Way
- 248 Exie Ln
- 223 Bryan Ave
- 224 Bryan Ave
- 245 Bryan Ave
- 581 N Crawford Ave Unit 41
- 923 E Whittaker Way
- 991 E Whittaker Way
- 1021 E Whittaker Way
- 786 S College Ave
- 964 E Sierra Way
- 780 S College Ave
- 930 E Whittaker Way
- 810 S College Ave
- 942 E Sierra Way
- 960 E Whittaker Way
- 990 E Whittaker Way
- 920 E Sierra Way
- 982 E Sierra Way
- 1049 E Whittaker Way
- 846 S College Ave
- 1024 E Sierra Way
- 1024 E Whittaker Way
- 910 E Sierra Way
- 1036 E Sierra Way
- 1036 E Sierra Way
Your Personal Tour Guide
Ask me questions while you tour the home.