Estimated Value: $275,000 - $332,000
2
Beds
2
Baths
1,039
Sq Ft
$281/Sq Ft
Est. Value
About This Home
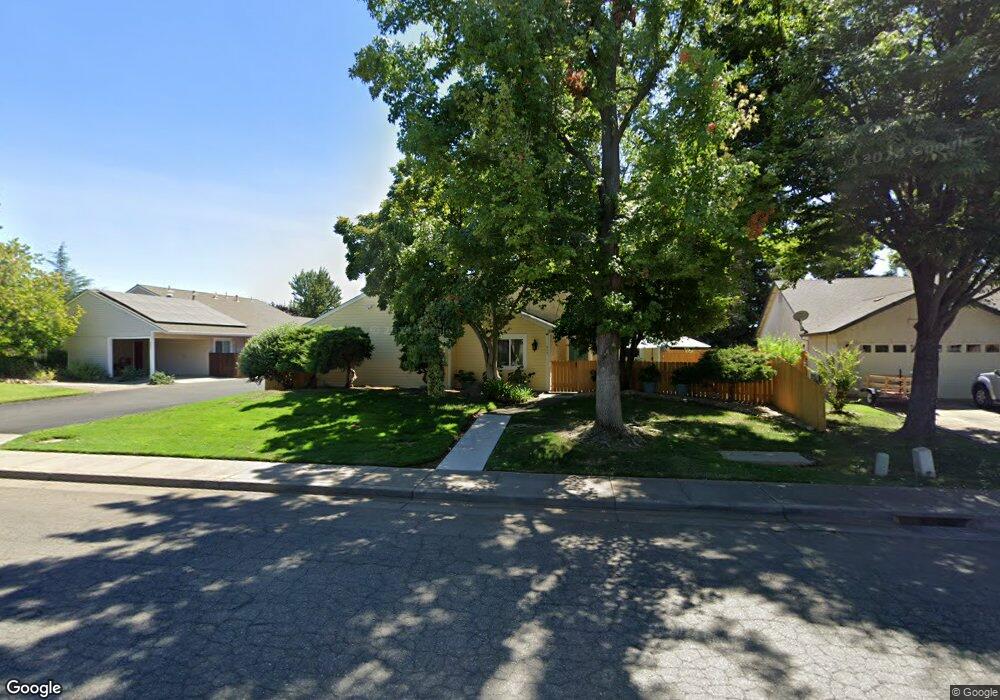
This home is located at 977 Flying V St, Chico, CA 95928 and is currently estimated at $291,594, approximately $280 per square foot. 977 Flying V St is a home located in Butte County with nearby schools including Little Chico Creek Elementary School, Harry M. Marsh Junior High School, and Chico High School.
Ownership History
Date
Name
Owned For
Owner Type
Purchase Details
Closed on
Apr 6, 2018
Sold by
Robbins Marianne and Diggs Marianne Robbins
Bought by
Diggs Stephen Michael and Diggs Marianne Robbins
Current Estimated Value
Purchase Details
Closed on
Dec 23, 2009
Sold by
Brown Gregory
Bought by
Robbins Marianne
Purchase Details
Closed on
Dec 23, 2008
Sold by
Brown Gregory and Gregory Brown Revocable Inter
Bought by
Brown Gregory and Robbins Marianne
Purchase Details
Closed on
Sep 18, 2003
Sold by
Brown Gregory B
Bought by
Brown Gregory and The Gregory Brown Revocable Inter Vivos
Purchase Details
Closed on
Apr 18, 2002
Sold by
Skyway Properties Ltd
Bought by
Brown Gregory B
Home Financials for this Owner
Home Financials are based on the most recent Mortgage that was taken out on this home.
Original Mortgage
$86,400
Interest Rate
7.13%
Mortgage Type
Purchase Money Mortgage
Create a Home Valuation Report for This Property
The Home Valuation Report is an in-depth analysis detailing your home's value as well as a comparison with similar homes in the area
Purchase History
| Date | Buyer | Sale Price | Title Company |
|---|---|---|---|
| Diggs Stephen Michael | -- | None Available | |
| Robbins Marianne | -- | Bidwell Title & Escrow Co | |
| Brown Gregory | -- | None Available | |
| Brown Gregory | -- | -- | |
| Brown Gregory B | -- | Bidwell Title & Escrow Compa |
Source: Public Records
Mortgage History
| Date | Status | Borrower | Loan Amount |
|---|---|---|---|
| Previous Owner | Brown Gregory B | $86,400 |
Source: Public Records
Tax History
| Year | Tax Paid | Tax Assessment Tax Assessment Total Assessment is a certain percentage of the fair market value that is determined by local assessors to be the total taxable value of land and additions on the property. | Land | Improvement |
|---|---|---|---|---|
| 2025 | $1,498 | $142,736 | $47,572 | $95,164 |
| 2024 | $1,498 | $139,939 | $46,640 | $93,299 |
| 2023 | $1,479 | $137,196 | $45,726 | $91,470 |
| 2022 | $1,457 | $134,507 | $44,830 | $89,677 |
| 2021 | $1,424 | $131,870 | $43,951 | $87,919 |
| 2020 | $1,422 | $130,519 | $43,501 | $87,018 |
| 2019 | $1,398 | $127,961 | $42,649 | $85,312 |
| 2018 | $1,369 | $125,453 | $41,813 | $83,640 |
| 2017 | $1,337 | $122,994 | $40,994 | $82,000 |
| 2016 | $1,222 | $120,584 | $40,191 | $80,393 |
| 2015 | -- | $118,774 | $39,588 | $79,186 |
| 2014 | -- | $116,448 | $38,813 | $77,635 |
Source: Public Records
Map
Nearby Homes
- 12 Wrangler Ct
- 2375 Notre Dame Blvd Unit 9
- 2375 Notre Dame Blvd Unit 1
- 2251 Notre Dame Blvd
- 1 Parkhurst St
- 123 Raley Blvd
- 3731 Morrow Ln
- 0 Rim Rock Dr Unit PA26026954
- 2325 Dr Martin Luther King Junior
- 0 5 9 Ac Corner of Yosemite & Humboldt Rd Unit SN25118517
- 0 Rim Rock Dr Unit SN24199604
- 370 Yarrow Dr
- 2050 Springfield Dr Unit 101
- 2050 Springfield Dr Unit 212
- 2215 Laurel St
- 2294 Mulberry St
- 1802 Notre Dame Blvd
- 2099 Hartford Dr Unit 6
- 467 E 22nd St
- 2055 Amanda Way Unit 26
- 979 Flying V St
- 765 Flying V St
- 981 Flying V St
- 983 Flying V St
- 985 Flying V St
- 0 Flying V St
- 755 Flying V St
- 2261 La Rocco Dr
- 4 Wrangler Ct
- 6 Wrangler Ct
- 2 Wrangler Ct
- 989 Flying V St
- 8 Wrangler Ct
- 2259 La Rocco Dr
- 991 Flying V St
- 3 Wrangler Ct
- 993 Flying V St
- 2257 La Rocco Dr
- 2345 Forest Ave
- 10 Wrangler Ct
Your Personal Tour Guide
Ask me questions while you tour the home.