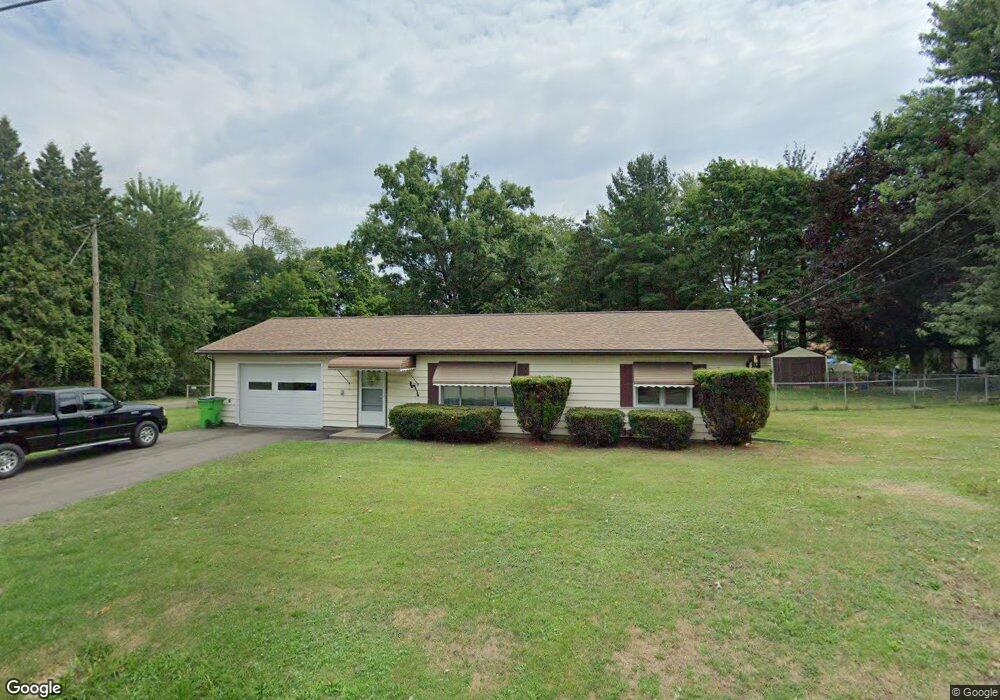
977 Klinger Ave Alliance, OH 44601
Estimated Value: $103,000 - $132,000
2
Beds
1
Bath
912
Sq Ft
$127/Sq Ft
Est. Value
About This Home
This home is located at 977 Klinger Ave, Alliance, OH 44601 and is currently estimated at $115,413, approximately $126 per square foot. 977 Klinger Ave is a home located in Stark County with nearby schools including Alliance Early Learning School, Alliance Intermediate School at Northside, and Alliance Middle School.
Ownership History
Date
Name
Owned For
Owner Type
Purchase Details
Closed on
Feb 21, 2025
Sold by
Larkins Joseph G and Larkins Diane M
Bought by
Larkins Joseph G and Larkins Diane M
Current Estimated Value
Purchase Details
Closed on
Jul 18, 1996
Sold by
Kelley William E
Bought by
Larkins Joseph G
Home Financials for this Owner
Home Financials are based on the most recent Mortgage that was taken out on this home.
Original Mortgage
$57,970
Interest Rate
8.31%
Mortgage Type
New Conventional
Purchase Details
Closed on
Apr 27, 1995
Sold by
Kosa Gary W
Bought by
Kelly William E and Kelly Mary
Home Financials for this Owner
Home Financials are based on the most recent Mortgage that was taken out on this home.
Original Mortgage
$46,400
Interest Rate
8.42%
Mortgage Type
FHA
Create a Home Valuation Report for This Property
The Home Valuation Report is an in-depth analysis detailing your home's value as well as a comparison with similar homes in the area
Home Values in the Area
Average Home Value in this Area
Purchase History
| Date | Buyer | Sale Price | Title Company |
|---|---|---|---|
| Larkins Joseph G | -- | None Listed On Document | |
| Larkins Joseph G | $54,900 | -- | |
| Kelly William E | $45,900 | -- |
Source: Public Records
Mortgage History
| Date | Status | Borrower | Loan Amount |
|---|---|---|---|
| Previous Owner | Larkins Joseph G | $57,970 | |
| Previous Owner | Kelly William E | $46,400 |
Source: Public Records
Tax History
| Year | Tax Paid | Tax Assessment Tax Assessment Total Assessment is a certain percentage of the fair market value that is determined by local assessors to be the total taxable value of land and additions on the property. | Land | Improvement |
|---|---|---|---|---|
| 2025 | -- | $29,620 | $14,040 | $15,580 |
| 2024 | -- | $29,620 | $14,040 | $15,580 |
| 2023 | $913 | $22,720 | $8,580 | $14,140 |
| 2022 | $460 | $22,720 | $8,580 | $14,140 |
| 2021 | $920 | $22,720 | $8,580 | $14,140 |
| 2020 | $802 | $18,490 | $7,040 | $11,450 |
| 2019 | $790 | $18,490 | $7,040 | $11,450 |
Source: Public Records
Map
Nearby Homes
- 000 Meadowbrook Ave
- 550 Johnson Ave
- 0 Meadowbrook Ave
- 11335 Meadowbrook Ave NE
- 0 Homestead Ave NE
- 432 Johnson Ave
- 347 Buckeye Ave
- 717 Garfield Ave
- 160 Bonnieview Ave
- 118 S Mckinley Ave
- 0 W Main St Unit 5090123
- 0 Meadow St NE
- 264 W Market St
- 479 W High St
- 171 1/2 W Main St
- 505 N Union Ave
- 163 W Market St
- 10580 Heltman Ave NE
- 664 Fairview Place
- 710 N Freedom Ave
- 955 Klinger Ave
- 1015 Klinger Ave
- 1010 Klinger Ave
- 942 Ashland Ave
- 968 Klinger Ave
- 944 Ashland Ave
- 948 Klinger Ave
- 1227 W Vine St
- 1221 W Vine St
- 1030 Klinger Ave
- 1305 W Vine St
- 1050 Klinger Ave
- 985 Nantucket Cir NE
- 965 Nantucket Cir NE
- 1005 Nantucket Cir NE
- 1331 W Vine St
- 1025 Nantucket Cir NE
- 0 Klinger Ave
- 1045 Nantucket Cir NE
- 1045 Nantucket Cir NE
Your Personal Tour Guide
Ask me questions while you tour the home.