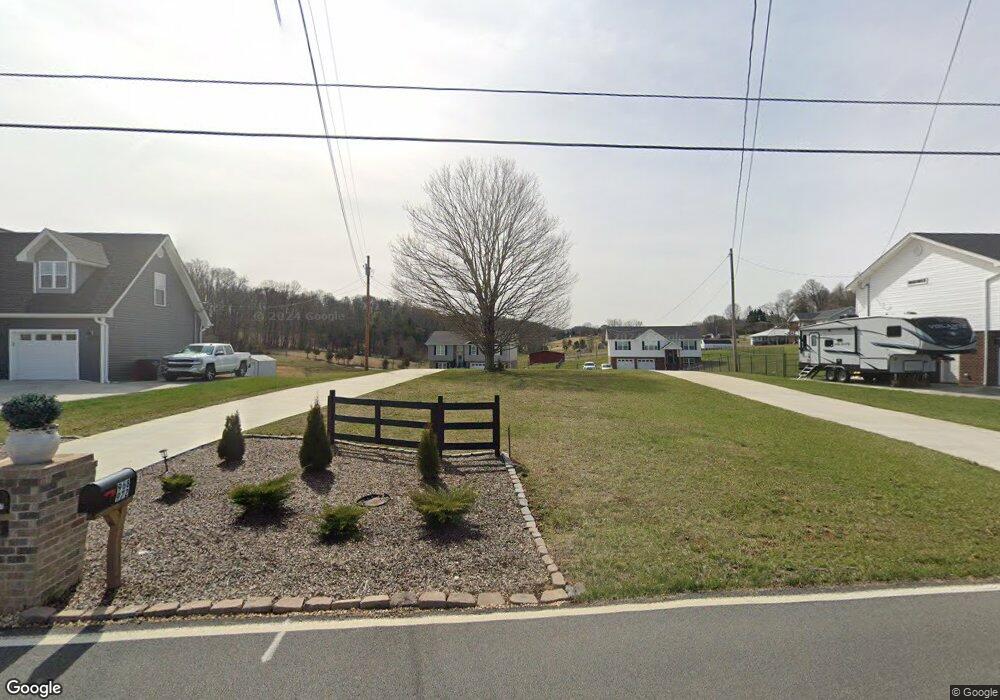
977 Mitchell Rd Kingsport, TN 37663
Estimated Value: $64,928 - $390,000
--
Bed
--
Bath
576
Sq Ft
$464/Sq Ft
Est. Value
About This Home
This home is located at 977 Mitchell Rd, Kingsport, TN 37663 and is currently estimated at $266,982, approximately $463 per square foot. 977 Mitchell Rd is a home located in Sullivan County with nearby schools including John Adams Elementary School, Ross N. Robinson Middle School, and Dobyns-Bennett High School.
Ownership History
Date
Name
Owned For
Owner Type
Purchase Details
Closed on
Mar 6, 2025
Sold by
Wilkerson Matthew Gene and May Karen
Bought by
King Bobby
Current Estimated Value
Purchase Details
Closed on
Jun 5, 2020
Sold by
Ki Ro Investments Llc
Bought by
Vaughn Ricky P and Vaughn Rebecca L
Home Financials for this Owner
Home Financials are based on the most recent Mortgage that was taken out on this home.
Original Mortgage
$100,000
Interest Rate
3.3%
Mortgage Type
Future Advance Clause Open End Mortgage
Purchase Details
Closed on
May 21, 2020
Sold by
Wilkerson Matthew Gene
Bought by
Ki Ro Investments Llc
Home Financials for this Owner
Home Financials are based on the most recent Mortgage that was taken out on this home.
Original Mortgage
$100,000
Interest Rate
3.3%
Mortgage Type
Future Advance Clause Open End Mortgage
Purchase Details
Closed on
Dec 6, 2010
Sold by
Wilkerson Luann
Bought by
Wilkerson Matthew Gene
Create a Home Valuation Report for This Property
The Home Valuation Report is an in-depth analysis detailing your home's value as well as a comparison with similar homes in the area
Home Values in the Area
Average Home Value in this Area
Purchase History
| Date | Buyer | Sale Price | Title Company |
|---|---|---|---|
| King Bobby | -- | Williams Title | |
| King Bobby | -- | Williams Title | |
| Vaughn Ricky P | $153,000 | Heritage Ttl & Closing Svcs | |
| Ki Ro Investments Llc | $100,000 | Heritage Ttl & Closing Svcs | |
| Wilkerson Matthew Gene | $45,060 | -- |
Source: Public Records
Mortgage History
| Date | Status | Borrower | Loan Amount |
|---|---|---|---|
| Previous Owner | Ki Ro Investments Llc | $100,000 |
Source: Public Records
Tax History Compared to Growth
Tax History
| Year | Tax Paid | Tax Assessment Tax Assessment Total Assessment is a certain percentage of the fair market value that is determined by local assessors to be the total taxable value of land and additions on the property. | Land | Improvement |
|---|---|---|---|---|
| 2024 | -- | $7,200 | $6,525 | $675 |
| 2023 | $317 | $7,200 | $6,525 | $675 |
| 2022 | $317 | $7,200 | $6,525 | $675 |
| 2021 | $308 | $7,200 | $6,525 | $675 |
| 2020 | $273 | $7,200 | $6,525 | $675 |
| 2019 | $269 | $5,800 | $5,225 | $575 |
| 2018 | $263 | $5,800 | $5,225 | $575 |
| 2017 | $263 | $5,800 | $5,225 | $575 |
| 2016 | $271 | $5,825 | $5,225 | $600 |
| 2014 | $255 | $5,834 | $0 | $0 |
Source: Public Records
Map
Nearby Homes
- Tbd Eastern Star Rd
- 118 Copas Rd
- 000 Fordtown Rd
- 268 Eastern Star Rd
- 248 Bayberry Dr
- 292 Alpine Trail
- 132 Breckenridge Trace
- 120 Breckenridge Trace
- 674 Sumpter Rd
- 1080 Hidden Valley Rd
- 2016 Arlington Dr
- 604 Snapps Ferry Rd
- 1145 Ridge Parke
- 00 Fordtown Rd
- TBD Fordtown Td
- 112 Hillview Rd
- 1153 Ridge Parke
- 1201 Meadow Ln
- 1169 Ridge Parke
- 117 Quail Heights Ct
- 977 Mitchell Rd
- 961 Mitchell Rd
- 965 Mitchell Rd
- 305 Pickens Rd
- 313 Pickens Rd
- 953 Mitchell Rd
- 341 Pickens Rd
- 1002 Mitchell Rd
- 300 Pickens Rd
- 333 Pickens Rd
- 326 Pickens Rd
- 944 Mitchell Rd
- 957 Mitchell Rd
- 1003 Mitchell Rd
- 1016 Mitchell Rd
- 351 Pickens Rd
- 1020 Mitchell Rd
- 340 Pickens Rd
- 972 Mitchell Rd
- 928 Mitchell Rd