Estimated Value: $374,886 - $422,000
4
Beds
3
Baths
2,038
Sq Ft
$193/Sq Ft
Est. Value
About This Home
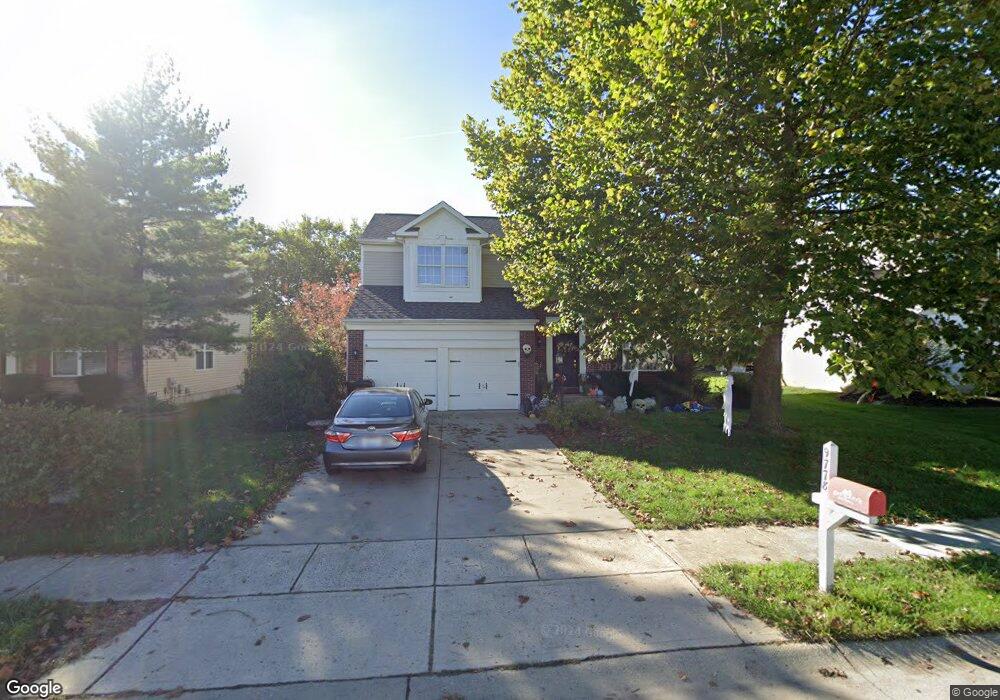
This home is located at 9778 Cherbourg Dr Unit 135, Union, KY 41091 and is currently estimated at $392,972, approximately $192 per square foot. 9778 Cherbourg Dr Unit 135 is a home located in Boone County with nearby schools including Erpenbeck Elementary School, Ockerman Middle School, and Larry A. Ryle High School.
Ownership History
Date
Name
Owned For
Owner Type
Purchase Details
Closed on
Aug 5, 2024
Sold by
Denton Araceli and Swan James
Bought by
Swan James and Swan Araceli
Current Estimated Value
Home Financials for this Owner
Home Financials are based on the most recent Mortgage that was taken out on this home.
Original Mortgage
$251,322
Outstanding Balance
$248,423
Interest Rate
6.77%
Mortgage Type
FHA
Estimated Equity
$144,549
Purchase Details
Closed on
Apr 7, 2005
Sold by
Swan James
Bought by
Bourne Edward M
Purchase Details
Closed on
Feb 10, 2000
Sold by
Ryland Group Inc
Bought by
Blankenship Kevin W and Blankenship Debbie A
Home Financials for this Owner
Home Financials are based on the most recent Mortgage that was taken out on this home.
Original Mortgage
$187,300
Interest Rate
8.11%
Mortgage Type
New Conventional
Purchase Details
Closed on
Nov 3, 1999
Sold by
A & K Enterprise Inc
Bought by
Ryland Group Inc
Create a Home Valuation Report for This Property
The Home Valuation Report is an in-depth analysis detailing your home's value as well as a comparison with similar homes in the area
Home Values in the Area
Average Home Value in this Area
Purchase History
| Date | Buyer | Sale Price | Title Company |
|---|---|---|---|
| Swan James | -- | Title 365 | |
| Swan James | -- | Title 365 | |
| Bourne Edward M | -- | None Available | |
| Blankenship Kevin W | $197,186 | -- | |
| Ryland Group Inc | $27,210 | -- |
Source: Public Records
Mortgage History
| Date | Status | Borrower | Loan Amount |
|---|---|---|---|
| Open | Swan James | $251,322 | |
| Closed | Swan James | $251,322 | |
| Previous Owner | Blankenship Kevin W | $187,300 |
Source: Public Records
Tax History Compared to Growth
Tax History
| Year | Tax Paid | Tax Assessment Tax Assessment Total Assessment is a certain percentage of the fair market value that is determined by local assessors to be the total taxable value of land and additions on the property. | Land | Improvement |
|---|---|---|---|---|
| 2024 | $1,877 | $210,410 | $30,000 | $180,410 |
| 2023 | $1,942 | $210,410 | $30,000 | $180,410 |
| 2022 | $2,362 | $210,410 | $30,000 | $180,410 |
| 2021 | $2,442 | $210,410 | $30,000 | $180,410 |
| 2020 | $2,409 | $210,410 | $30,000 | $180,410 |
| 2019 | $2,437 | $210,410 | $30,000 | $180,410 |
| 2018 | $2,476 | $210,410 | $30,000 | $180,410 |
| 2017 | $2,401 | $210,410 | $30,000 | $180,410 |
| 2015 | $2,371 | $210,410 | $30,000 | $180,410 |
| 2013 | -- | $215,690 | $30,000 | $185,690 |
Source: Public Records
Map
Nearby Homes
- 9807 Cherbourg Dr
- 3832 Sonata Dr
- 1974 Prosperity Ct
- 9154 Armistead Ct
- 8540 Concerto Ct
- 8558 Concerto Ct Unit 251C
- 8554 Concerto Ct Unit 251B
- 8550 Concerto Ct Unit 251A
- 8566 Concerto Ct
- 8554 Concerto Ct
- 8558 Concerto Ct
- 8570 Concerto Ct
- 8550 Concerto Ct
- 8520 Concerto Ct
- 8524 Concerto Ct
- 8536 Concerto Ct
- 8528 Concerto Ct
- DARDEN Plan at Harmony - Harmony Bluffs Condos
- CAYWOOD Plan at Harmony - Harmony Bluffs Condos
- ATWOOD Plan at Harmony - Harmony Bluffs Condos
- 9778 Cherbourg Dr
- 9776 Cherbourg Dr
- 9780 Cherbourg Dr
- 9766 Soaring Breezes
- 9758 Soaring Breezes
- 9754 Soaring Breezes
- 9774 Cherbourg Dr
- 9770 Soaring Breezes Unit 92
- 9770 Soaring Breezes
- 9779 Cherbourg Dr
- 9779 Cherbourg Dr Unit 129
- 9783 Cherbourg Dr
- 9762 Soaring Breezes Unit 94
- 9762 Soaring Breezes
- 9774 Soaring Breezes Unit 91
- 9774 Soaring Breezes
- 9775 Cherbourg Dr
- 9772 Cherbourg Dr
- 9784 Cherbourg Dr
- 9179 Soaring Breezes