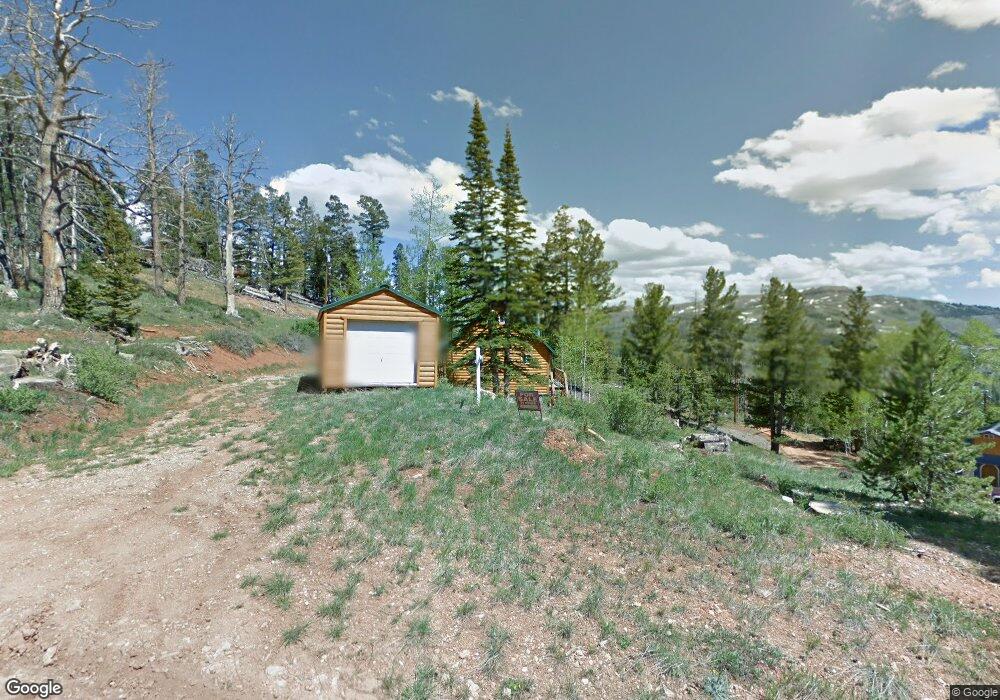
978 N Aspen Dr Brian Head, UT 84719
Estimated Value: $295,970 - $315,000
2
Beds
2
Baths
900
Sq Ft
$340/Sq Ft
Est. Value
About This Home
This home is located at 978 N Aspen Dr, Brian Head, UT 84719 and is currently estimated at $306,323, approximately $340 per square foot. 978 N Aspen Dr is a home located in Iron County with nearby schools including Parowan School, Parowan High School, and Cedar City High School.
Ownership History
Date
Name
Owned For
Owner Type
Purchase Details
Closed on
Nov 12, 2025
Sold by
Elmquist John A
Bought by
John Elmquist Living Trust and Elmquist
Current Estimated Value
Purchase Details
Closed on
Dec 22, 2020
Sold by
Elmquist John A
Bought by
Elmquist John A
Home Financials for this Owner
Home Financials are based on the most recent Mortgage that was taken out on this home.
Original Mortgage
$202,300
Interest Rate
2.8%
Mortgage Type
New Conventional
Purchase Details
Closed on
Jan 12, 2019
Sold by
Flynn Thomas J and Flynn Vera S
Bought by
Elmquist John A
Home Financials for this Owner
Home Financials are based on the most recent Mortgage that was taken out on this home.
Original Mortgage
$193,050
Interest Rate
4.7%
Mortgage Type
New Conventional
Purchase Details
Closed on
Aug 15, 2005
Sold by
Coutts Richard W and Coutts Johan E
Bought by
Flynn Thomas J and Flynn Vera S
Home Financials for this Owner
Home Financials are based on the most recent Mortgage that was taken out on this home.
Original Mortgage
$128,000
Interest Rate
5.56%
Mortgage Type
New Conventional
Create a Home Valuation Report for This Property
The Home Valuation Report is an in-depth analysis detailing your home's value as well as a comparison with similar homes in the area
Home Values in the Area
Average Home Value in this Area
Purchase History
| Date | Buyer | Sale Price | Title Company |
|---|---|---|---|
| John Elmquist Living Trust | -- | None Listed On Document | |
| Elmquist John A | -- | Accommodation | |
| Elmquist John A | -- | Security Escrow & Ttl Ins Ag | |
| Flynn Thomas J | -- | -- |
Source: Public Records
Mortgage History
| Date | Status | Borrower | Loan Amount |
|---|---|---|---|
| Previous Owner | Elmquist John A | $202,300 | |
| Previous Owner | Elmquist John A | $193,050 | |
| Previous Owner | Flynn Thomas J | $128,000 |
Source: Public Records
Tax History Compared to Growth
Tax History
| Year | Tax Paid | Tax Assessment Tax Assessment Total Assessment is a certain percentage of the fair market value that is determined by local assessors to be the total taxable value of land and additions on the property. | Land | Improvement |
|---|---|---|---|---|
| 2025 | $1,022 | $137,305 | $27,500 | $109,805 |
| 2023 | $1,029 | $111,575 | $20,215 | $91,360 |
| 2022 | $1,576 | $186,005 | $35,000 | $151,005 |
| 2021 | $1,046 | $123,440 | $15,000 | $108,440 |
| 2020 | $1,184 | $123,440 | $15,000 | $108,440 |
| 2019 | $1,192 | $119,250 | $15,000 | $104,250 |
| 2018 | $1,171 | $114,415 | $15,000 | $99,415 |
| 2017 | $1,075 | $105,495 | $15,000 | $90,495 |
| 2016 | $1,099 | $97,380 | $15,000 | $82,380 |
| 2015 | $1,050 | $88,710 | $0 | $0 |
| 2014 | $999 | $79,745 | $0 | $0 |
Source: Public Records
Map
Nearby Homes
- 1272 N Aspen Dr
- 0 Aspen Dr Unit M & B
- 1224 N Aspen Dr
- 660 W Ski View Dr
- 524 W Ski View Dr
- 531 W Kokopelli Loop
- 237 Circle Dr
- 603 N Half Circle Dr
- 678 W Ski View Dr
- 565 N Half Circle Dr
- 321 W Spruce St Unit 4
- 699 W Hunter Ridge Dr
- 464 N Highway 143 Unit 105A
- 464 N Hwy 143 Unit A211
- 464 N Hwy 143 Unit A110-A111
- 464 N Hwy 143 Unit A110-111
- 464 N Hwy 143 Unit B107
- 464 N Hwy 143 Unit A308
- 438 Holyoak Cir
- 0 W Hunter Ridge Dr
- 978 Aspen Dr
- TBD N Aspen Dr
- 911 Yankee Lookout Rd
- 911 Yankee Lookout Rd
- 0 Lot 11 Blk B Sve Unit A Unit A
- 1006 N Aspen Dr Unit Ski View Estate u-a
- 1006 N Aspen Dr
- LOT 10 Blk A Ski View Estates
- 943 N Aspen Dr
- 1028 N Aspen Dr
- 1150 N Aspen Dr Unit SVE U-A B-B lot 21
- 865 N Aspen Dr Unit Lot 22 and 23 SVE U-
- 1416 N Aspen Dr Unit Lots 15 & 16Blk A Sk
- 11147 N Aspen Dr Unit Lots 21 & 22 Blk A S
- 1066 N Aspen Dr Unit Lots 16 & 17 SVE U-A
- 1309 N Aspen Dr Unit lot 10 b-B Ski View
- 1321 N Aspen Dr Unit Lot 11 b-B Ski View
- 1293 N Aspen Dr Unit Ski View Estates lot
- 1219 N Aspen Dr Unit SVE U-B B-B 3
- 931 N Aspen Dr