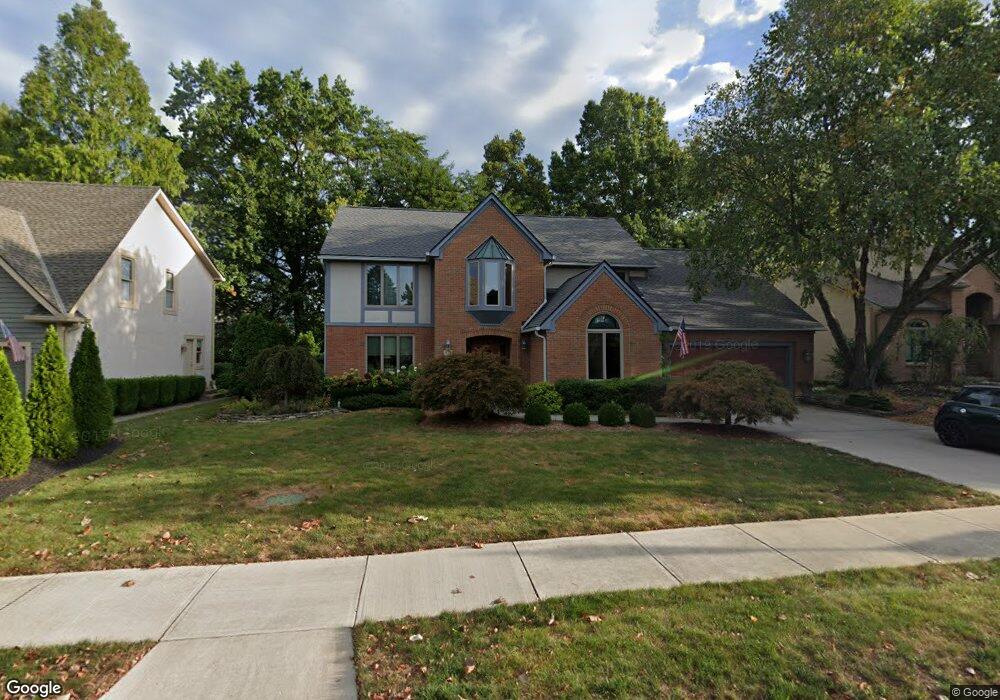
978 Valleyview Dr Westerville, OH 43081
Estimated Value: $573,373 - $741,000
4
Beds
4
Baths
2,913
Sq Ft
$219/Sq Ft
Est. Value
About This Home
This home is located at 978 Valleyview Dr, Westerville, OH 43081 and is currently estimated at $639,093, approximately $219 per square foot. 978 Valleyview Dr is a home located in Franklin County with nearby schools including Mcvay Elementary School, Walnut Springs Middle School, and Westerville-North High School.
Ownership History
Date
Name
Owned For
Owner Type
Purchase Details
Closed on
Aug 28, 2023
Sold by
Rosenthal Gary L and Rosenthal Teressa M
Bought by
Gary L Rosenthal Trust and Teressa M Rosenthal Trust
Current Estimated Value
Purchase Details
Closed on
Oct 31, 2000
Sold by
Declaratio Stevenson Charles N and Declaratio Charles N Stevenson
Bought by
Rosenthal Gary L and Rosenthal Teressa M
Home Financials for this Owner
Home Financials are based on the most recent Mortgage that was taken out on this home.
Original Mortgage
$204,800
Interest Rate
7.87%
Mortgage Type
Purchase Money Mortgage
Purchase Details
Closed on
Jun 10, 1999
Sold by
Gallo James J and Gallo Laura L
Bought by
Stevenson Charles N and Stevenson Joni B
Purchase Details
Closed on
Oct 18, 1994
Sold by
Neher Jeffrey M
Bought by
James J and James Gallo
Purchase Details
Closed on
Mar 31, 1993
Purchase Details
Closed on
Oct 23, 1987
Create a Home Valuation Report for This Property
The Home Valuation Report is an in-depth analysis detailing your home's value as well as a comparison with similar homes in the area
Home Values in the Area
Average Home Value in this Area
Purchase History
| Date | Buyer | Sale Price | Title Company |
|---|---|---|---|
| Gary L Rosenthal Trust | -- | None Listed On Document | |
| Rosenthal Gary L | -- | None Listed On Document | |
| Rosenthal Gary L | $256,000 | Esquire Title | |
| Stevenson Charles N | $254,700 | Chicago Title West | |
| James J | $218,000 | -- | |
| -- | $198,000 | -- | |
| -- | $40,000 | -- |
Source: Public Records
Mortgage History
| Date | Status | Borrower | Loan Amount |
|---|---|---|---|
| Previous Owner | Rosenthal Gary L | $204,800 |
Source: Public Records
Tax History Compared to Growth
Tax History
| Year | Tax Paid | Tax Assessment Tax Assessment Total Assessment is a certain percentage of the fair market value that is determined by local assessors to be the total taxable value of land and additions on the property. | Land | Improvement |
|---|---|---|---|---|
| 2024 | $10,405 | $183,090 | $52,500 | $130,590 |
| 2023 | $10,185 | $183,090 | $52,500 | $130,590 |
| 2022 | $9,598 | $131,740 | $23,590 | $108,150 |
| 2021 | $9,679 | $131,740 | $23,590 | $108,150 |
| 2020 | $9,651 | $131,740 | $23,590 | $108,150 |
| 2019 | $8,458 | $108,990 | $19,670 | $89,320 |
| 2018 | $8,202 | $108,990 | $19,670 | $89,320 |
| 2017 | $8,347 | $108,990 | $19,670 | $89,320 |
| 2016 | $8,376 | $99,900 | $24,540 | $75,360 |
| 2015 | $8,112 | $99,900 | $24,540 | $75,360 |
| 2014 | $8,118 | $99,900 | $24,540 | $75,360 |
| 2013 | $3,860 | $95,130 | $23,380 | $71,750 |
Source: Public Records
Map
Nearby Homes
- 969 Farrington Dr
- 613 Valley Wood Ct
- 1003 Autumn Meadows Dr
- 858 Knebworth Ct
- 1368 Nutmeg Ct
- 1015 Autumn Woods Dr
- 994 Autumn Lake Ct
- 857 E Walnut St
- 539 Cherrington Rd
- 1203 Autumn Creek Cir
- 283 Apache Cir
- 615 Vancouver Dr
- 192 Buckeye Ct
- 187 Bernadine Ct
- 430 Electric Ave
- 768 Collingwood Dr
- 437 Potawatomi Dr
- 393 Sentry Ln
- 974 Timberbank Dr
- 203 Fairdale Ave
- 978 Valleyview Ct
- 986 Valleyview Dr
- 970 Valleyview Ct
- 986 Valleyview Ct
- 467 Mainsail Dr
- 477 Mainsail Dr
- 459 Mainsail Dr
- 964 Valleyview Ct
- 964 Valleyview Ct
- 451 Mainsail Dr
- 458 Glenview Ct
- 461 Glenview Ct
- 960 Valleyview Dr
- 960 Valleyview Ct
- 0 Valleyview Dr
- 443 Mainsail Dr
- 462 Mainsail Dr
- 454 Mainsail Dr
- 480 Mainsail Dr
- 446 Mainsail Dr