9780 Estepa Ct Myrtle Beach, SC 29579
Grande Dunes NeighborhoodEstimated Value: $1,860,000 - $2,250,992
4
Beds
7
Baths
7,800
Sq Ft
$273/Sq Ft
Est. Value
About This Home
This home is located at 9780 Estepa Ct, Myrtle Beach, SC 29579 and is currently estimated at $2,131,498, approximately $273 per square foot. 9780 Estepa Ct is a home located in Horry County with nearby schools including Myrtle Beach Child Development Center, Myrtle Beach Elementary School, and Myrtle Beach Primary School.
Ownership History
Date
Name
Owned For
Owner Type
Purchase Details
Closed on
Jan 14, 2011
Sold by
Letourneau Daniel R
Bought by
White Michael H
Current Estimated Value
Purchase Details
Closed on
May 26, 2010
Sold by
Master In Equity Horry County
Bought by
Regions Bank
Purchase Details
Closed on
May 21, 2010
Sold by
Regions Bank
Bought by
Letourneau Daniel R
Purchase Details
Closed on
Sep 1, 2006
Sold by
Grande Dunes Development Co Llc
Bought by
Omni Design Build Group Llc
Home Financials for this Owner
Home Financials are based on the most recent Mortgage that was taken out on this home.
Original Mortgage
$10,000,000
Interest Rate
6.52%
Mortgage Type
Construction
Purchase Details
Closed on
May 25, 2006
Sold by
Burroughs & Chapin Co Inc
Bought by
Grande Dunes Development Co Llc
Create a Home Valuation Report for This Property
The Home Valuation Report is an in-depth analysis detailing your home's value as well as a comparison with similar homes in the area
Home Values in the Area
Average Home Value in this Area
Purchase History
| Date | Buyer | Sale Price | Title Company |
|---|---|---|---|
| White Michael H | $850,000 | -- | |
| Regions Bank | -- | -- | |
| Letourneau Daniel R | $550,000 | -- | |
| Omni Design Build Group Llc | $479,228 | None Available | |
| Grande Dunes Development Co Llc | -- | None Available |
Source: Public Records
Mortgage History
| Date | Status | Borrower | Loan Amount |
|---|---|---|---|
| Previous Owner | Omni Design Build Group Llc | $10,000,000 |
Source: Public Records
Tax History Compared to Growth
Tax History
| Year | Tax Paid | Tax Assessment Tax Assessment Total Assessment is a certain percentage of the fair market value that is determined by local assessors to be the total taxable value of land and additions on the property. | Land | Improvement |
|---|---|---|---|---|
| 2024 | $20,872 | $134,548 | $28,743 | $105,805 |
| 2023 | $20,872 | $71,288 | $11,054 | $60,234 |
| 2021 | $19,263 | $90,108 | $14,178 | $75,930 |
| 2020 | $18,371 | $90,108 | $14,178 | $75,930 |
| 2019 | $18,371 | $90,108 | $14,178 | $75,930 |
| 2018 | $16,489 | $71,635 | $9,613 | $62,022 |
| 2017 | $16,303 | $71,635 | $9,613 | $62,022 |
| 2016 | -- | $71,635 | $9,613 | $62,022 |
| 2015 | $16,117 | $71,635 | $9,613 | $62,022 |
| 2014 | $15,671 | $71,635 | $9,613 | $62,022 |
Source: Public Records
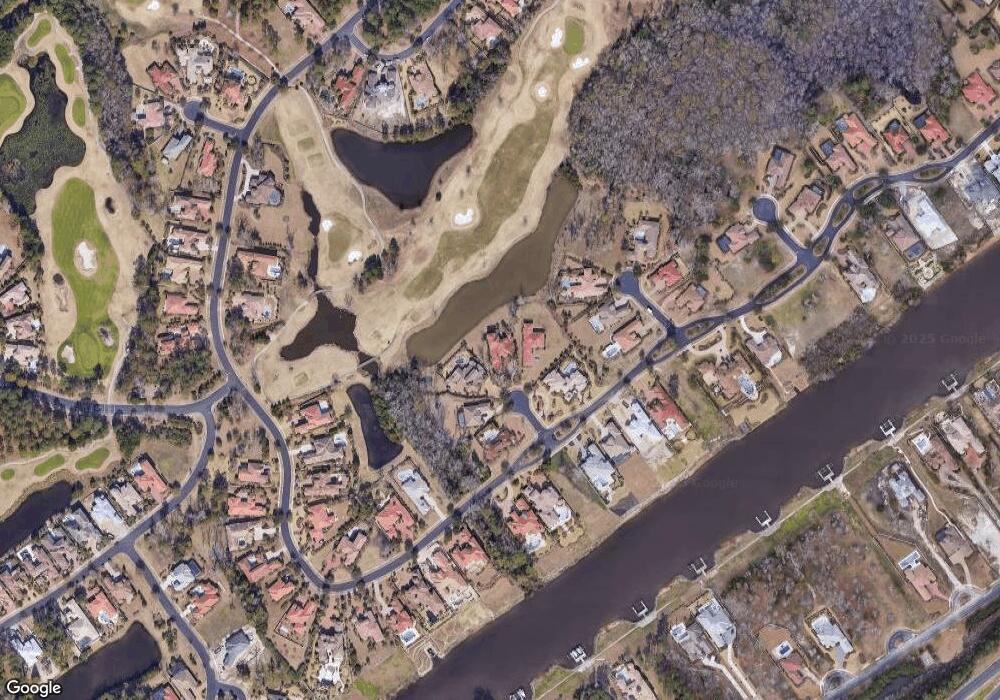
Map
Nearby Homes
- 9675 Ravello Ct
- 9684 Ravello Ct
- 9765 Ravello Ct
- 9891 Bellasera Cir
- 9185 Marina Pkwy
- 1501 Serena Dr
- 9235 Marina Pkwy Unit GRANDE DUNES BAL HAR
- 9590 Bellasera Cir
- 9237 Bellasera Cir
- 9243 Marina Pkwy
- 9285 Bellasera Cir
- 9107 Marina Pkwy
- 9552 Lugano Ct
- 1330 Villa Marbella Ct Unit 303
- 9329 Marina Pkwy
- 9325 Cove Dr
- 9305 Cove Dr
- 9318 Cove Dr
- 9485 Ronda Ct
- 0 Charleston Ct Unit Lot 2 Dunes Cove
- 9776 Estepa Ct Unit 105 Members Club @ G
- 9783 Estepa Ct Unit 103 Members Club
- 9779 Estepa Ct
- 9779 Estepa Ct Unit 102 Members Club
- 9770 Estepa Ct
- 9770 Estepa Ct Unit Lot 106 Members Clu
- 9770 Estepa Ct Unit 106 Members Club
- 9737 Catalonia Ct Unit 109 Members
- 9737 Catalonia Ct Unit 109 Members Club
- 9771 Estepa Ct
- 9771 Estepa Ct Unit Members Club 101
- tbd Bellasera Cir Unit Lot 77 & Lot 78
- 9733 Catalonia Ct
- 9729 Catalonia Ct
- 9811 Bellasera Cir
- Lot 107 Catalonia Ct
- Lot 113 Catalonia Ct
- Lot 111 Catalonia Ct
- 9742 Catalonia Ct
- 9742 Catalonia Ct Unit LOT 110