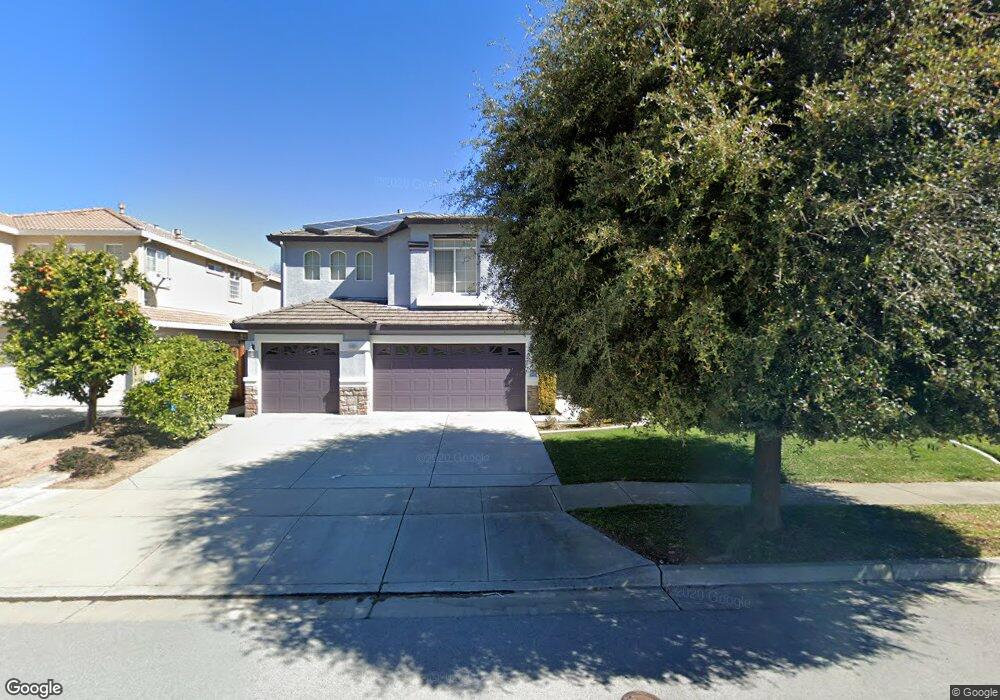
9780 Rancho Hills Dr Gilroy, CA 95020
Las Animas NeighborhoodEstimated Value: $1,363,000 - $1,529,000
5
Beds
3
Baths
3,012
Sq Ft
$479/Sq Ft
Est. Value
About This Home
This home is located at 9780 Rancho Hills Dr, Gilroy, CA 95020 and is currently estimated at $1,441,498, approximately $478 per square foot. 9780 Rancho Hills Dr is a home located in Santa Clara County with nearby schools including Luigi Aprea Elementary School, Brownell Middle School, and Solorsano Middle School.
Ownership History
Date
Name
Owned For
Owner Type
Purchase Details
Closed on
Nov 18, 2004
Sold by
Ross Gretchen M
Bought by
Ross Gretchen M
Current Estimated Value
Purchase Details
Closed on
Sep 17, 2004
Sold by
Ross Gretchen M and Mahlberg Therese J
Bought by
Ross Gretchen M
Home Financials for this Owner
Home Financials are based on the most recent Mortgage that was taken out on this home.
Original Mortgage
$571,000
Outstanding Balance
$248,060
Interest Rate
4.06%
Mortgage Type
Purchase Money Mortgage
Estimated Equity
$1,193,438
Purchase Details
Closed on
Jun 11, 2001
Sold by
Maxxum Management Company
Bought by
Ross Gretchen M and Mahlberg Therese J
Home Financials for this Owner
Home Financials are based on the most recent Mortgage that was taken out on this home.
Original Mortgage
$551,000
Interest Rate
7.14%
Create a Home Valuation Report for This Property
The Home Valuation Report is an in-depth analysis detailing your home's value as well as a comparison with similar homes in the area
Home Values in the Area
Average Home Value in this Area
Purchase History
| Date | Buyer | Sale Price | Title Company |
|---|---|---|---|
| Ross Gretchen M | -- | -- | |
| Ross Gretchen M | $285,500 | Alliance Title Company | |
| Ross Gretchen M | $675,000 | Alliance Title Company |
Source: Public Records
Mortgage History
| Date | Status | Borrower | Loan Amount |
|---|---|---|---|
| Open | Ross Gretchen M | $571,000 | |
| Closed | Ross Gretchen M | $551,000 |
Source: Public Records
Tax History Compared to Growth
Tax History
| Year | Tax Paid | Tax Assessment Tax Assessment Total Assessment is a certain percentage of the fair market value that is determined by local assessors to be the total taxable value of land and additions on the property. | Land | Improvement |
|---|---|---|---|---|
| 2025 | $13,289 | $1,103,477 | $376,701 | $726,776 |
| 2024 | $13,289 | $1,081,841 | $369,315 | $712,526 |
| 2023 | $13,211 | $1,060,629 | $362,074 | $698,555 |
| 2022 | $12,994 | $1,039,833 | $354,975 | $684,858 |
| 2021 | $12,938 | $1,019,445 | $348,015 | $671,430 |
| 2020 | $12,795 | $1,008,993 | $344,447 | $664,546 |
| 2019 | $12,675 | $989,210 | $337,694 | $651,516 |
| 2018 | $10,920 | $895,000 | $305,500 | $589,500 |
| 2017 | $11,311 | $890,000 | $300,000 | $590,000 |
| 2016 | $11,357 | $893,700 | $304,700 | $589,000 |
| 2015 | $9,543 | $784,000 | $267,600 | $516,400 |
| 2014 | $9,154 | $742,000 | $253,300 | $488,700 |
Source: Public Records
Map
Nearby Homes
- 1515 Dovetail Way
- 9881 Rancho Hills Dr
- 0 Geri Ln
- 1469 Eagles Nest Ln
- 1810 Carob Ct
- 9250 Mahogany Ct
- 9110 Tea Tree Way
- 2302 Hoya Ln
- 9045 Tea Tree Way
- 9850 Bobcat Ct
- 1080 Sunrise Dr
- 10260 Lucky Ct
- 1469 Goshawk Ct
- 1482 Goshawk Ct
- 9938 Bobcat Ct
- 2391 Mantelli Dr
- 8940 Acorn Way
- 9632 Cherrywood Ct
- 8745 Wild Iris Dr
- 2330 Stonecress St
- 9786 Rancho Hills Dr
- 9770 Rancho Hills Dr
- 9765 Rancho Hills Dr
- 9731 Linnet Ct
- 9760 Rancho Hills Dr
- 9790 Rancho Hills Dr
- 1650 Dovetail Way
- 9781 Rancho Hills Dr
- 1640 Dovetail Way
- 9771 Rancho Hills Dr
- 9750 Rancho Hills Dr
- 9801 Rancho Hills Dr
- 9741 Linnet Ct
- 9791 Rancho Hills Dr
- 1630 Dovetail Way
- 9730 Linnet Ct
- 9761 Rancho Hills Dr
- 9731 Rancho Hills Dr
- 9805 Rancho Hills Dr
- 9740 Rancho Hills Dr