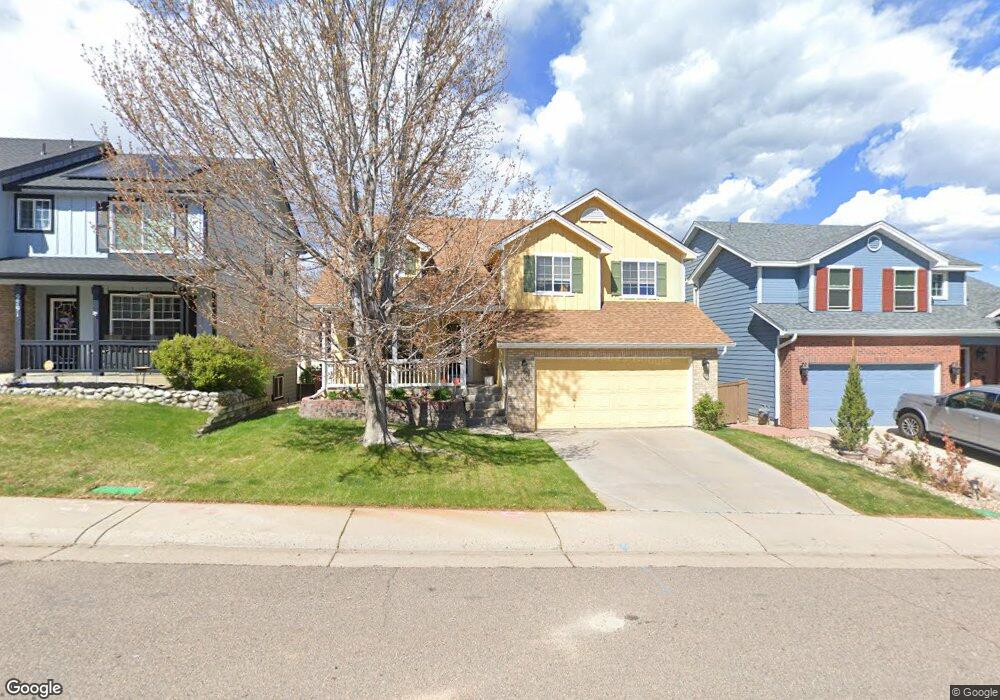
9781 Bucknell Ct Highlands Ranch, CO 80129
Westridge NeighborhoodEstimated Value: $529,000 - $656,000
3
Beds
4
Baths
1,900
Sq Ft
$315/Sq Ft
Est. Value
About This Home
This home is located at 9781 Bucknell Ct, Highlands Ranch, CO 80129 and is currently estimated at $598,065, approximately $314 per square foot. 9781 Bucknell Ct is a home located in Douglas County with nearby schools including Trailblazer Elementary School, Ranch View Middle School, and Thunderridge High School.
Ownership History
Date
Name
Owned For
Owner Type
Purchase Details
Closed on
Oct 15, 2021
Sold by
Bowman Blayne S and Bowman Carol Ann
Bought by
Bowman Blayne and Bowman Carol
Current Estimated Value
Home Financials for this Owner
Home Financials are based on the most recent Mortgage that was taken out on this home.
Original Mortgage
$250,000
Outstanding Balance
$227,977
Interest Rate
2.8%
Mortgage Type
New Conventional
Estimated Equity
$370,088
Purchase Details
Closed on
Feb 15, 2002
Sold by
The Joel M Hubbard Trust
Bought by
Bowman Blayne S and Bowman Carol Ann
Home Financials for this Owner
Home Financials are based on the most recent Mortgage that was taken out on this home.
Original Mortgage
$175,000
Interest Rate
7.12%
Purchase Details
Closed on
Mar 8, 2001
Sold by
Crowe Lawrence E
Bought by
The Lawrence E Crowe Trust
Purchase Details
Closed on
Dec 27, 1995
Sold by
Village Homes Of Colorado Inc
Bought by
Hubbard Joel M and Crowe Lawrence E
Purchase Details
Closed on
Jul 28, 1995
Sold by
Mission Viejo Co
Bought by
Village Homes Colo Inc
Create a Home Valuation Report for This Property
The Home Valuation Report is an in-depth analysis detailing your home's value as well as a comparison with similar homes in the area
Home Values in the Area
Average Home Value in this Area
Purchase History
| Date | Buyer | Sale Price | Title Company |
|---|---|---|---|
| Bowman Blayne | -- | Cherry Creek Title | |
| Bowman Blayne S | $245,000 | Land Title | |
| The Lawrence E Crowe Trust | -- | -- | |
| The Joel M Hubbard Trust | -- | -- | |
| Hubbard Joel M | $163,746 | Land Title | |
| Village Homes Colo Inc | $87,700 | -- |
Source: Public Records
Mortgage History
| Date | Status | Borrower | Loan Amount |
|---|---|---|---|
| Open | Bowman Blayne | $250,000 | |
| Closed | Bowman Blayne S | $175,000 |
Source: Public Records
Tax History Compared to Growth
Tax History
| Year | Tax Paid | Tax Assessment Tax Assessment Total Assessment is a certain percentage of the fair market value that is determined by local assessors to be the total taxable value of land and additions on the property. | Land | Improvement |
|---|---|---|---|---|
| 2024 | $2,971 | $41,900 | $8,620 | $33,280 |
| 2023 | $2,965 | $41,900 | $8,620 | $33,280 |
| 2022 | $2,148 | $30,460 | $5,960 | $24,500 |
| 2021 | $2,233 | $30,460 | $5,960 | $24,500 |
| 2020 | $2,107 | $29,860 | $5,620 | $24,240 |
| 2019 | $2,115 | $29,860 | $5,620 | $24,240 |
| 2018 | $1,788 | $26,110 | $4,980 | $21,130 |
| 2017 | $2,247 | $26,110 | $4,980 | $21,130 |
| 2016 | $2,031 | $23,160 | $4,030 | $19,130 |
| 2015 | $2,074 | $23,160 | $4,030 | $19,130 |
| 2014 | $1,854 | $19,110 | $4,540 | $14,570 |
Source: Public Records
Map
Nearby Homes
- 9711 Bucknell Way
- 3644 Rosewalk Cir
- 9821 Rock Dove Ln
- 3641 Rosewalk Cir
- 9477 S Hackberry Ln
- 9488 S Hackberry Ln
- 9409 S Hackberry Ln
- 10054 Deer Creek St
- 9755 Spring Hill St
- 2841 High Cliffe Place
- 9227 Gold Lace Place
- 9178 Gold Lace Place
- 10347 Woodrose Ln
- 2590 W Bitterroot Place
- 2572 W Bitterroot Place
- 2174 Cactus Bluff Ave
- 2596 Bitterroot Place
- 1993 Mountain Maple Ave
- Daley Plan at Westridge
- Dayton Plan at Westridge
- 9791 Bucknell Ct
- 9737 Bucknell Ct
- 3643 Bucknell Dr
- 3637 Bucknell Dr
- 3649 Bucknell Dr
- 9782 Bucknell Ct
- 9774 Bucknell Ct
- 3631 Bucknell Dr
- 9792 Bucknell Ct
- 9764 Bucknell Ct
- 9811 Bucknell Ct
- 9738 Bucknell Ct
- 9802 Bucknell Ct
- 9728 Bucknell Ct
- 9756 Bucknell Ct
- 9746 Bucknell Ct
- 3625 Bucknell Dr
- 9720 Bucknell Ct
- 9783 Bucknell Way
- 9789 Bucknell Way