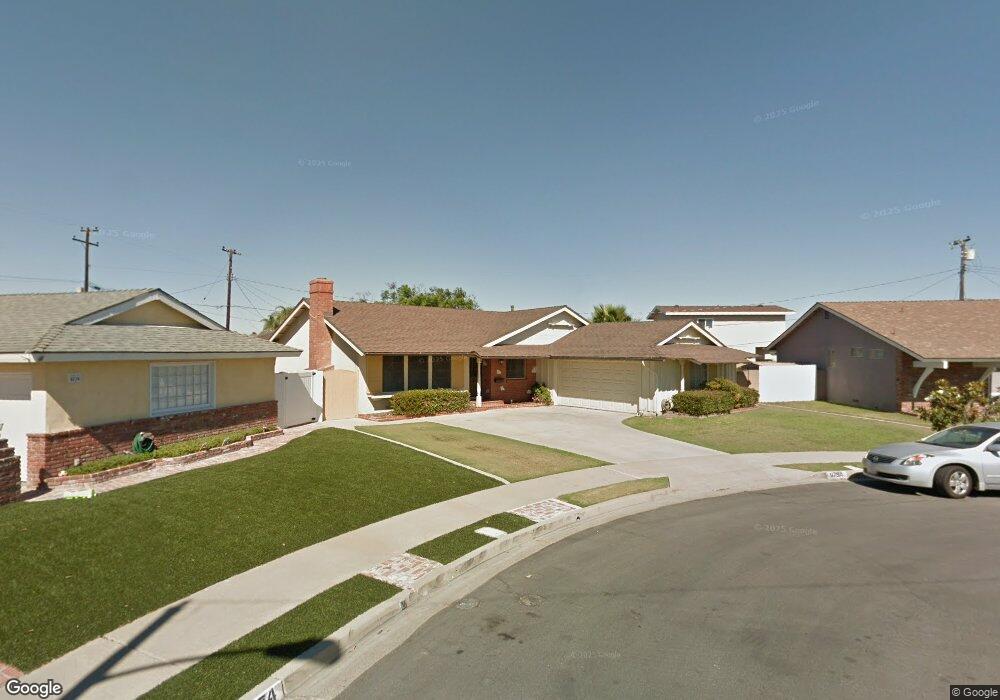
9784 Saint John Cir Cypress, CA 90630
Estimated Value: $958,000 - $1,302,000
3
Beds
2
Baths
1,834
Sq Ft
$622/Sq Ft
Est. Value
About This Home
This home is located at 9784 Saint John Cir, Cypress, CA 90630 and is currently estimated at $1,140,688, approximately $621 per square foot. 9784 Saint John Cir is a home located in Orange County with nearby schools including Juliet Morris Elementary School, Lexington Junior High School, and Cypress High School.
Ownership History
Date
Name
Owned For
Owner Type
Purchase Details
Closed on
May 31, 2018
Sold by
Jenkins Thomas L
Bought by
Jenkins Thomas L and Jenkins Donna R
Current Estimated Value
Purchase Details
Closed on
Apr 14, 2017
Sold by
Jenkins Thomas L
Bought by
Jenkins Thomas L
Purchase Details
Closed on
Nov 21, 2016
Sold by
Jenkins Thomas L
Bought by
Jenkins Thomas L and Jenkins Donna R
Purchase Details
Closed on
May 24, 2016
Sold by
Jenkins Thomas L
Bought by
Jenkins Thomas L
Purchase Details
Closed on
Jul 5, 2011
Sold by
Jenkins Phillip E
Bought by
Jenkins Phillip E
Purchase Details
Closed on
Jun 8, 2000
Sold by
Jenkins Margaret M Revocable Trust
Bought by
Jenkins Ronald J and Ronald J Jenkins Revocable Trust
Create a Home Valuation Report for This Property
The Home Valuation Report is an in-depth analysis detailing your home's value as well as a comparison with similar homes in the area
Home Values in the Area
Average Home Value in this Area
Purchase History
| Date | Buyer | Sale Price | Title Company |
|---|---|---|---|
| Jenkins Thomas L | -- | None Available | |
| Jenkins Thomas L | -- | None Available | |
| Jenkins Thomas L | -- | None Available | |
| Jenkins Thomas L | -- | None Available | |
| Jenkins Phillip E | -- | None Available | |
| Jenkins Ronald J | -- | -- |
Source: Public Records
Tax History Compared to Growth
Tax History
| Year | Tax Paid | Tax Assessment Tax Assessment Total Assessment is a certain percentage of the fair market value that is determined by local assessors to be the total taxable value of land and additions on the property. | Land | Improvement |
|---|---|---|---|---|
| 2025 | $6,529 | $576,524 | $458,291 | $118,233 |
| 2024 | $6,529 | $565,220 | $449,305 | $115,915 |
| 2023 | $6,381 | $554,138 | $440,495 | $113,643 |
| 2022 | $6,308 | $543,273 | $431,858 | $111,415 |
| 2021 | $6,226 | $532,621 | $423,390 | $109,231 |
| 2020 | $6,202 | $527,160 | $419,049 | $108,111 |
| 2019 | $6,027 | $516,824 | $410,832 | $105,992 |
| 2018 | $5,947 | $506,691 | $402,777 | $103,914 |
| 2017 | $5,743 | $496,756 | $394,879 | $101,877 |
| 2016 | $5,696 | $649,760 | $550,023 | $99,737 |
| 2015 | $5,655 | $479,701 | $381,321 | $98,380 |
| 2014 | $5,354 | $470,305 | $373,852 | $96,453 |
Source: Public Records
Map
Nearby Homes
- 9678 Walker Ct
- 9565 Graham St
- 9011 Cerise Ln Unit 121
- 9011 Cerise Ln
- 9011 Cerise Ln Unit 122
- Plan B1X at Citrus Square - Cerise
- Plan B1 at Citrus Square - Cerise
- Plan A1 at Citrus Square - Cerise
- Plan A2 at Citrus Square - Cerise
- 5041 Myra Ave
- 9001 Cerise Ln Unit 109
- 9001 Cerise Ln Unit 113
- 6007 Clementine Ln Unit 21
- 5411 Marion Ave
- 9574 Tivoli Cir
- 5000 Clementine Ln
- 5763 Laguna Way Unit 49
- 5841 Laguna Way Unit 62
- 5472 Marion Ave
- 5511 Kanel Cir
- 9774 Saint John Cir
- 9785 Saint George Cir
- 9794 Saint John Cir
- 9795 Saint George Cir
- 9775 Saint George Cir
- 9814 Saint John Cir
- 9773 Saint John Cir
- 9815 Saint George Cir
- 9783 Saint John Cir
- 9793 Saint John Cir
- 9824 Saint John Cir
- 5305 Canterbury Dr
- 5285 Canterbury Dr
- 9813 Saint John Cir
- 9825 Saint George Cir
- 9776 Saint George Cir
- 5315 Canterbury Dr
- 5275 Canterbury Dr
- 9786 Saint George Cir
- 9796 Saint George Cir