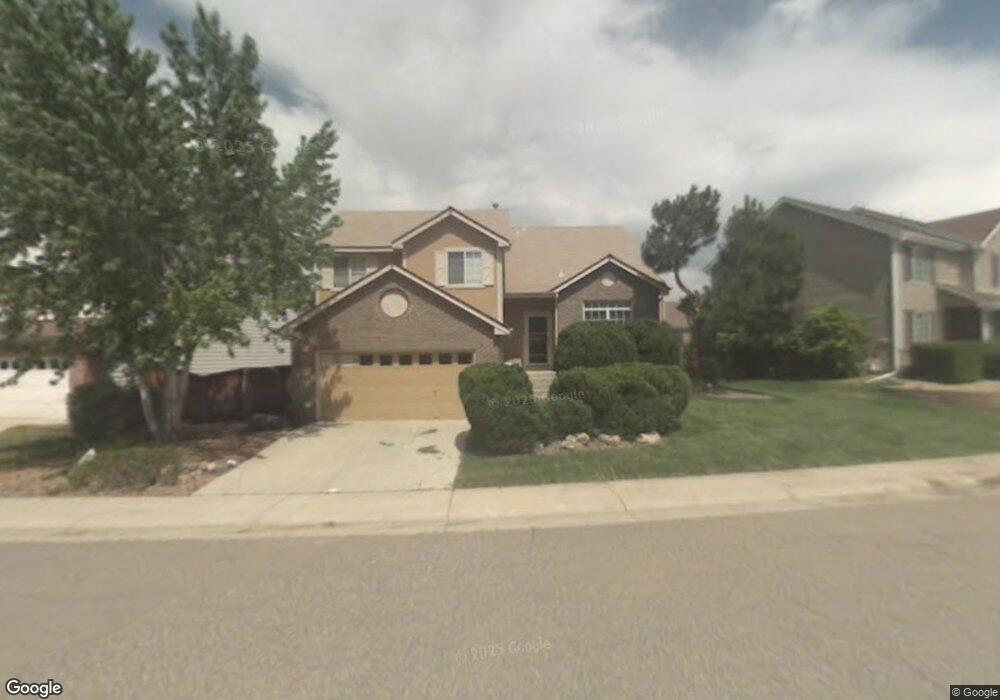
9785 Foxhill Cir Highlands Ranch, CO 80129
Westridge NeighborhoodEstimated Value: $603,000 - $657,000
3
Beds
4
Baths
1,802
Sq Ft
$347/Sq Ft
Est. Value
About This Home
This home is located at 9785 Foxhill Cir, Highlands Ranch, CO 80129 and is currently estimated at $624,864, approximately $346 per square foot. 9785 Foxhill Cir is a home located in Douglas County with nearby schools including Trailblazer Elementary School, Ranch View Middle School, and Thunderridge High School.
Ownership History
Date
Name
Owned For
Owner Type
Purchase Details
Closed on
Aug 24, 2020
Sold by
Thirupukuzhi Vankipuram Srinivasan and Srinivasan Kartik
Bought by
Thirupukuzhi Vankipuram Srinivasan and Srinivasan Rajalakshmi
Current Estimated Value
Purchase Details
Closed on
Oct 6, 2002
Sold by
Pettigrew Robbin K
Bought by
Pettigrew Dorothy D
Home Financials for this Owner
Home Financials are based on the most recent Mortgage that was taken out on this home.
Original Mortgage
$100,000
Outstanding Balance
$42,292
Interest Rate
6.28%
Estimated Equity
$582,572
Purchase Details
Closed on
Feb 23, 1990
Sold by
Village Homes Ltd
Bought by
Pettigrew Robbin K and Pettigrew Dorothy D
Purchase Details
Closed on
Sep 15, 1989
Sold by
Mission Viejo Co
Bought by
Village Homes Ltd
Purchase Details
Closed on
Jul 18, 1989
Sold by
Mission Viejo Co
Bought by
Village Homes Ltd
Create a Home Valuation Report for This Property
The Home Valuation Report is an in-depth analysis detailing your home's value as well as a comparison with similar homes in the area
Home Values in the Area
Average Home Value in this Area
Purchase History
| Date | Buyer | Sale Price | Title Company |
|---|---|---|---|
| Thirupukuzhi Vankipuram Srinivasan | -- | Land Title Guarantee Company | |
| Pettigrew Dorothy D | -- | -- | |
| Pettigrew Robbin K | $104,500 | -- | |
| Village Homes Ltd | -- | -- | |
| Village Homes Ltd | $50,400 | -- |
Source: Public Records
Mortgage History
| Date | Status | Borrower | Loan Amount |
|---|---|---|---|
| Open | Pettigrew Dorothy D | $100,000 |
Source: Public Records
Tax History Compared to Growth
Tax History
| Year | Tax Paid | Tax Assessment Tax Assessment Total Assessment is a certain percentage of the fair market value that is determined by local assessors to be the total taxable value of land and additions on the property. | Land | Improvement |
|---|---|---|---|---|
| 2024 | $3,219 | $44,530 | $9,720 | $34,810 |
| 2023 | $3,213 | $44,530 | $9,720 | $34,810 |
| 2022 | $2,196 | $30,990 | $6,660 | $24,330 |
| 2021 | $2,283 | $30,990 | $6,660 | $24,330 |
| 2020 | $2,098 | $29,770 | $6,330 | $23,440 |
| 2019 | $2,106 | $29,770 | $6,330 | $23,440 |
| 2018 | $1,759 | $25,800 | $5,560 | $20,240 |
| 2017 | $2,220 | $25,800 | $5,560 | $20,240 |
| 2016 | $2,060 | $23,490 | $5,000 | $18,490 |
| 2015 | $2,104 | $23,490 | $5,000 | $18,490 |
| 2014 | $1,889 | $19,470 | $4,540 | $14,930 |
Source: Public Records
Map
Nearby Homes
- 9821 Rock Dove Ln
- 3644 Rosewalk Cir
- 3641 Rosewalk Cir
- 9711 Bucknell Way
- 10054 Deer Creek St
- 9755 Spring Hill St
- 9488 S Hackberry Ln
- 9477 S Hackberry Ln
- 9409 S Hackberry Ln
- 2841 High Cliffe Place
- 10347 Woodrose Ln
- 1993 Mountain Maple Ave
- 10505 Hyacinth Place
- 9227 Gold Lace Place
- 2627 Baneberry Ln
- 9178 Gold Lace Place
- 2174 Cactus Bluff Ave
- 1864 Mountain Maple Ave
- 2590 W Bitterroot Place
- 2572 W Bitterroot Place
- 9787 Foxhill Cir
- 9783 Foxhill Cir
- 9813 Rock Dove Ln
- 9817 Rock Dove Ln
- 9781 Foxhill Cir
- 9789 Foxhill Cir
- 9809 Rock Dove Ln
- 3441 Foxhill Ct
- 9786 Foxhill Cir
- 9779 Foxhill Cir
- 9791 Foxhill Cir
- 9788 Foxhill Cir
- 9805 Rock Dove Ln
- 3442 Foxhill Ct
- 3451 Foxhill Ct
- 9825 Rock Dove Ln
- 9790 Foxhill Cir
- 9902 Deer Creek St
- 9793 Foxhill Cir
- 9801 Rock Dove Ln