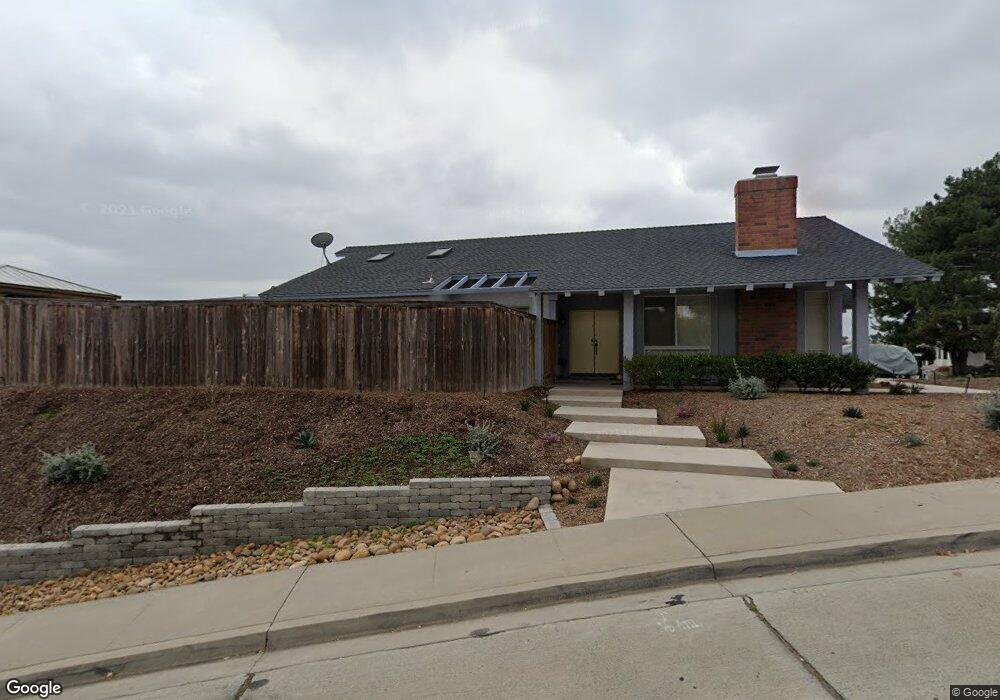
9787 Benavente Place San Diego, CA 92129
Rancho Peñasquitos NeighborhoodEstimated Value: $1,321,000 - $1,419,000
3
Beds
2
Baths
1,766
Sq Ft
$773/Sq Ft
Est. Value
About This Home
This home is located at 9787 Benavente Place, San Diego, CA 92129 and is currently estimated at $1,364,609, approximately $772 per square foot. 9787 Benavente Place is a home located in San Diego County with nearby schools including Canyon View Elementary School, Mesa Verde Middle School, and Westview High School.
Ownership History
Date
Name
Owned For
Owner Type
Purchase Details
Closed on
Jan 11, 2012
Sold by
Canter Da Fund 1 Llc
Bought by
Humphries Patrick Devail and Humphries Christina Linehan
Current Estimated Value
Home Financials for this Owner
Home Financials are based on the most recent Mortgage that was taken out on this home.
Original Mortgage
$458,653
Outstanding Balance
$312,326
Interest Rate
3.84%
Mortgage Type
VA
Estimated Equity
$1,052,283
Purchase Details
Closed on
Jul 6, 2011
Sold by
Elsken Daniel J and Elsken Laura C
Bought by
Canter Da Fund I Llc
Purchase Details
Closed on
Jul 26, 1994
Sold by
Connors William P and Connors Brenda J
Bought by
Elsken Daniel J and Elsken Laura C
Home Financials for this Owner
Home Financials are based on the most recent Mortgage that was taken out on this home.
Original Mortgage
$179,900
Interest Rate
8.7%
Purchase Details
Closed on
Jun 21, 1984
Create a Home Valuation Report for This Property
The Home Valuation Report is an in-depth analysis detailing your home's value as well as a comparison with similar homes in the area
Home Values in the Area
Average Home Value in this Area
Purchase History
| Date | Buyer | Sale Price | Title Company |
|---|---|---|---|
| Humphries Patrick Devail | $449,000 | Ticor Ttle Company | |
| Canter Da Fund I Llc | $388,000 | None Available | |
| Elsken Daniel J | $200,000 | Gateway Title Company | |
| -- | $130,000 | -- |
Source: Public Records
Mortgage History
| Date | Status | Borrower | Loan Amount |
|---|---|---|---|
| Open | Humphries Patrick Devail | $458,653 | |
| Previous Owner | Elsken Daniel J | $179,900 |
Source: Public Records
Tax History Compared to Growth
Tax History
| Year | Tax Paid | Tax Assessment Tax Assessment Total Assessment is a certain percentage of the fair market value that is determined by local assessors to be the total taxable value of land and additions on the property. | Land | Improvement |
|---|---|---|---|---|
| 2025 | $6,204 | $563,957 | $288,886 | $275,071 |
| 2024 | $6,204 | $552,900 | $283,222 | $269,678 |
| 2023 | $6,070 | $542,060 | $277,669 | $264,391 |
| 2022 | $5,966 | $531,432 | $272,225 | $259,207 |
| 2021 | $5,886 | $521,013 | $266,888 | $254,125 |
| 2020 | $5,806 | $515,672 | $264,152 | $251,520 |
| 2019 | $5,653 | $505,562 | $258,973 | $246,589 |
| 2018 | $5,493 | $495,650 | $253,896 | $241,754 |
| 2017 | $5,344 | $485,932 | $248,918 | $237,014 |
| 2016 | $5,233 | $476,405 | $244,038 | $232,367 |
| 2015 | $5,154 | $469,250 | $240,373 | $228,877 |
| 2014 | $5,031 | $460,059 | $235,665 | $224,394 |
Source: Public Records
Map
Nearby Homes
- 12940 Calle de Las Rosas
- 12979 Calle de Las Rosas
- 9562 Benavente St
- 10202 Vista Lusardi Unit LOT 9
- Plan 1 at Paseo Sereno
- Plan 2 at Paseo Sereno
- Plan 3 at Paseo Sereno
- 12811 Encantadora Unit 32
- 13113 Calle de Las Rosas
- 12727 Calle de Las Rosas
- 9959 Azuaga St Unit 105
- 10740 Sabre Hill Dr Unit 120
- 10776 Sabre Hill Dr Unit 150
- 10824 Sabre Hill Dr Unit 194
- 10756 Sabre Hill Dr Unit 265
- 9720 Graceland Way
- 9819 Kika Ct
- 9525 High Park Ln
- 9525 Vervain St
- 10131 Freeport Ct
- 9777 Benavente Place
- 9767 Benavente Place
- 12778 Mengibar Ave
- 12772 Mengibar Ave
- 12784 Mengibar Ave
- 12793 Cijon St
- 12797 Cijon St
- 12766 Mengibar Ave
- 9757 Benavente Place
- 12807 Cijon St
- 9780 Benavente Place
- 9770 Benavente Place
- 12760 Mengibar Ave
- 9760 Benavente Place
- 12787 Cijon St
- 12817 Cijon St
- 9747 Benavente Place
- 12783 Cijon St
- 12754 Mengibar Ave
- 12777 Cijon St