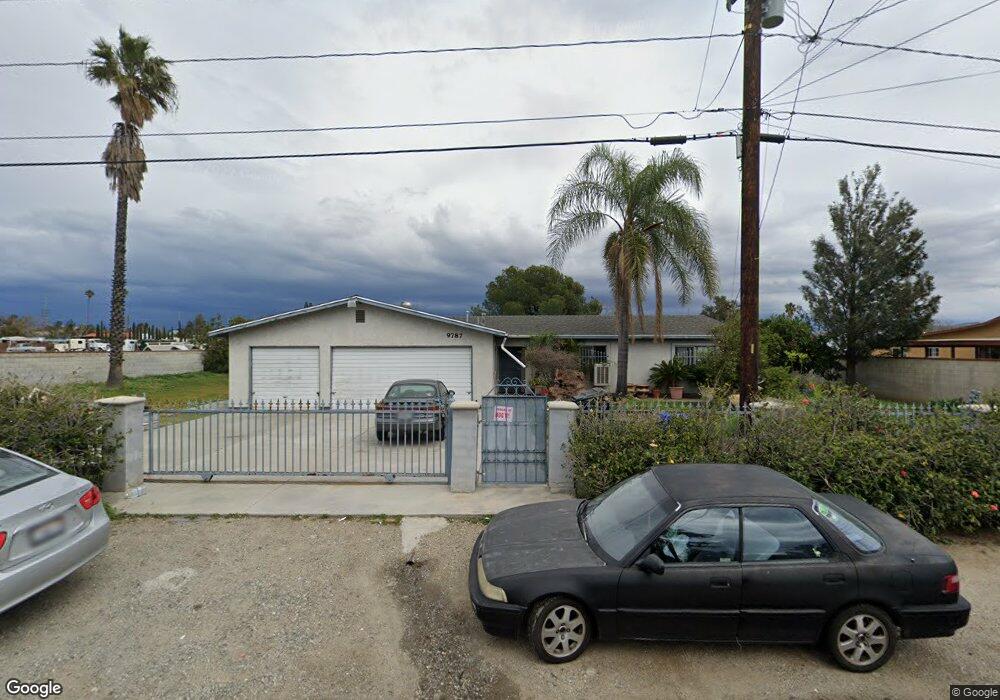
9787 Hemlock Ave Fontana, CA 92335
Estimated Value: $528,000 - $703,000
4
Beds
2
Baths
1,632
Sq Ft
$385/Sq Ft
Est. Value
About This Home
This home is located at 9787 Hemlock Ave, Fontana, CA 92335 and is currently estimated at $628,976, approximately $385 per square foot. 9787 Hemlock Ave is a home located in San Bernardino County with nearby schools including Poplar Elementary School, Sequoia Middle School, and Henry J. Kaiser High School.
Ownership History
Date
Name
Owned For
Owner Type
Purchase Details
Closed on
Apr 2, 2025
Sold by
Ortiz Maria M
Bought by
Ortiz Maria Marta and Ortiz Joel
Current Estimated Value
Purchase Details
Closed on
Feb 27, 2025
Sold by
Tamez Richard
Bought by
Ortiz Maria M
Purchase Details
Closed on
Aug 4, 2021
Sold by
Medinilla Anthony
Bought by
Tamez Richard
Home Financials for this Owner
Home Financials are based on the most recent Mortgage that was taken out on this home.
Original Mortgage
$230,000
Interest Rate
3%
Mortgage Type
New Conventional
Purchase Details
Closed on
Aug 3, 2021
Sold by
Ortiz Maria M
Bought by
Ortiz Maria M and Tamez Richard
Home Financials for this Owner
Home Financials are based on the most recent Mortgage that was taken out on this home.
Original Mortgage
$230,000
Interest Rate
3%
Mortgage Type
New Conventional
Purchase Details
Closed on
Jun 30, 2005
Sold by
Ortiz Enrique and Ortiz Maria
Bought by
Ortiz Maria M
Create a Home Valuation Report for This Property
The Home Valuation Report is an in-depth analysis detailing your home's value as well as a comparison with similar homes in the area
Purchase History
| Date | Buyer | Sale Price | Title Company |
|---|---|---|---|
| Ortiz Maria Marta | -- | None Listed On Document | |
| Ortiz Maria M | -- | None Listed On Document | |
| Tamez Richard | -- | Ticor Title Company Of Ca | |
| Ortiz Maria M | -- | Ticor Title Oc | |
| Ortiz Maria M | -- | -- |
Source: Public Records
Mortgage History
| Date | Status | Borrower | Loan Amount |
|---|---|---|---|
| Previous Owner | Tamez Richard | $230,000 | |
| Previous Owner | Ortiz Maria M | $230,000 |
Source: Public Records
Tax History
| Year | Tax Paid | Tax Assessment Tax Assessment Total Assessment is a certain percentage of the fair market value that is determined by local assessors to be the total taxable value of land and additions on the property. | Land | Improvement |
|---|---|---|---|---|
| 2025 | $1,994 | $184,533 | $59,733 | $124,800 |
| 2024 | $1,928 | $180,915 | $58,562 | $122,353 |
| 2023 | $1,879 | $177,368 | $57,414 | $119,954 |
| 2022 | $1,871 | $173,890 | $56,288 | $117,602 |
| 2021 | $1,773 | $170,480 | $55,184 | $115,296 |
| 2020 | $3,004 | $168,732 | $54,618 | $114,114 |
| 2019 | $2,158 | $165,423 | $53,547 | $111,876 |
| 2018 | $2,174 | $162,179 | $52,497 | $109,682 |
| 2017 | $2,172 | $158,999 | $51,468 | $107,531 |
| 2016 | $2,141 | $155,882 | $50,459 | $105,423 |
| 2015 | $2,090 | $153,540 | $49,701 | $103,839 |
| 2014 | $2,072 | $150,532 | $48,727 | $101,805 |
Source: Public Records
Map
Nearby Homes
- 14995 Manzanita Dr
- 17377 20 Valley Blvd
- 9995 Redwood Ave
- 14616 Hunter St
- 9268 Beech Ave
- 9784 Poplar Ave
- 10180 Redwood Ave
- 9963 Eugenia Ave
- 14989 Hibiscus Ave
- 10238 Cherry Ave
- 9952 Catawba Ave
- 8972 Carob Dr
- 15937 Manzanita Dr
- 0 Boyle Ave
- 14958 Granada Ave
- 15798 Slover Ave
- 16105 Rosemary Dr
- 9250 Citrus Ave Unit E
- 9876 Skyland Ct
- 9167 Citrus Ave
- 9805 Hemlock Ave
- 9813 Hemlock Ave
- 9784 Hemlock Ave
- 9796 Hemlock Ave
- 9776 Hemlock Ave
- 9808 Hemlock Ave
- 9768 Hemlock Ave
- 9820 Hemlock Ave
- 9739 Hemlock Ave
- 9756 Hemlock Ave
- 9778 Carob Ave Unit b
- 9778 Carob Ave Unit c
- 9778 Carob Ave
- 9830 Hemlock Ave
- 9737 Hemlock Ave
- 9744 Hemlock Ave
- 9848 Hemlock Ave
- 9848 Hemlock Ave
- 9734 Hemlock Ave
- 9727 Hemlock Ave
Your Personal Tour Guide
Ask me questions while you tour the home.