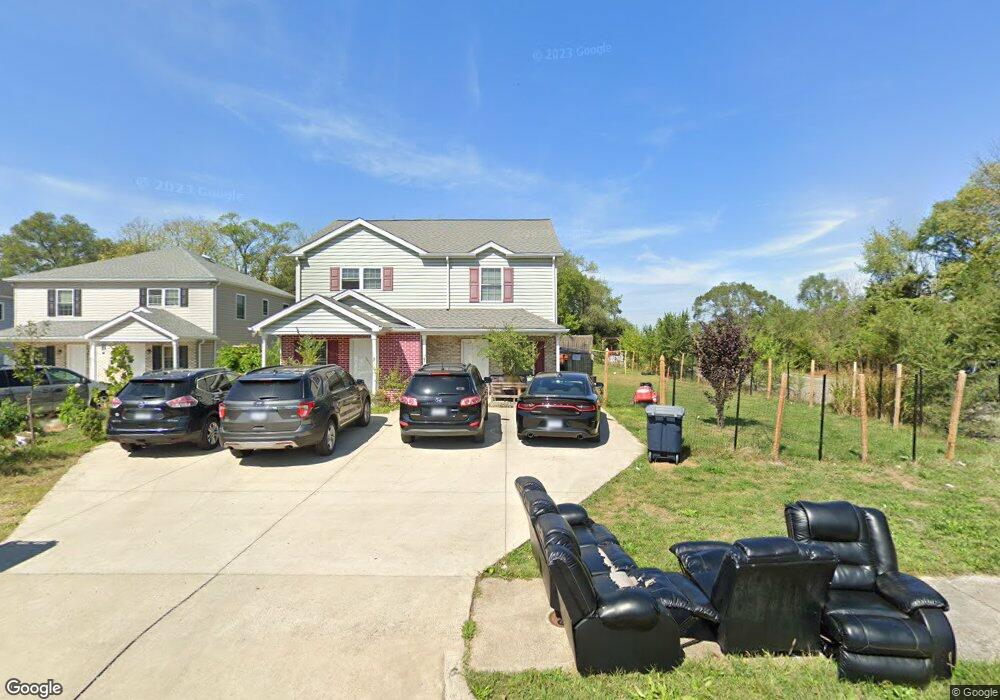
979 Roberts Ct Harrisonburg, VA 22802
Estimated Value: $253,000 - $306,000
3
Beds
2
Baths
1,216
Sq Ft
$229/Sq Ft
Est. Value
About This Home
This home is located at 979 Roberts Ct, Harrisonburg, VA 22802 and is currently estimated at $278,811, approximately $229 per square foot. 979 Roberts Ct is a home located in Harrisonburg City with nearby schools including Waterman Elementary School, Thomas Harrison Middle School, and Harrisonburg High School.
Ownership History
Date
Name
Owned For
Owner Type
Purchase Details
Closed on
Mar 25, 2019
Sold by
Central Valley Habitat For Humanity Inc
Bought by
Tekle Mehretu Zeray and Hailu Rahel Yosief
Current Estimated Value
Home Financials for this Owner
Home Financials are based on the most recent Mortgage that was taken out on this home.
Original Mortgage
$37,813
Outstanding Balance
$33,244
Interest Rate
4.3%
Mortgage Type
Stand Alone Second
Estimated Equity
$245,567
Create a Home Valuation Report for This Property
The Home Valuation Report is an in-depth analysis detailing your home's value as well as a comparison with similar homes in the area
Home Values in the Area
Average Home Value in this Area
Purchase History
| Date | Buyer | Sale Price | Title Company |
|---|---|---|---|
| Tekle Mehretu Zeray | $120,480 | Fidelity National Ttl Ins Co |
Source: Public Records
Mortgage History
| Date | Status | Borrower | Loan Amount |
|---|---|---|---|
| Open | Tekle Mehretu Zeray | $37,813 | |
| Closed | Tekle Mehretu Zeray | $37,813 |
Source: Public Records
Tax History Compared to Growth
Tax History
| Year | Tax Paid | Tax Assessment Tax Assessment Total Assessment is a certain percentage of the fair market value that is determined by local assessors to be the total taxable value of land and additions on the property. | Land | Improvement |
|---|---|---|---|---|
| 2024 | $2,395 | $237,100 | $41,800 | $195,300 |
| 2023 | $0 | $169,600 | $33,000 | $136,600 |
| 2022 | $0 | $154,400 | $30,000 | $124,400 |
| 2021 | $1,388 | $154,200 | $30,000 | $124,200 |
| 2020 | $1,235 | $143,600 | $30,000 | $113,600 |
| 2019 | $952 | $110,700 | $25,500 | $85,200 |
| 2018 | $212 | $25,500 | $25,500 | $0 |
| 2017 | $212 | $25,500 | $25,500 | $0 |
| 2016 | $212 | $25,500 | $25,500 | $0 |
| 2015 | $212 | $29,500 | $29,500 | $0 |
| 2014 | -- | $31,400 | $31,400 | $0 |
Source: Public Records
Map
Nearby Homes