Estimated Value: $135,000 - $187,000
3
Beds
1
Bath
1,380
Sq Ft
$116/Sq Ft
Est. Value
About This Home
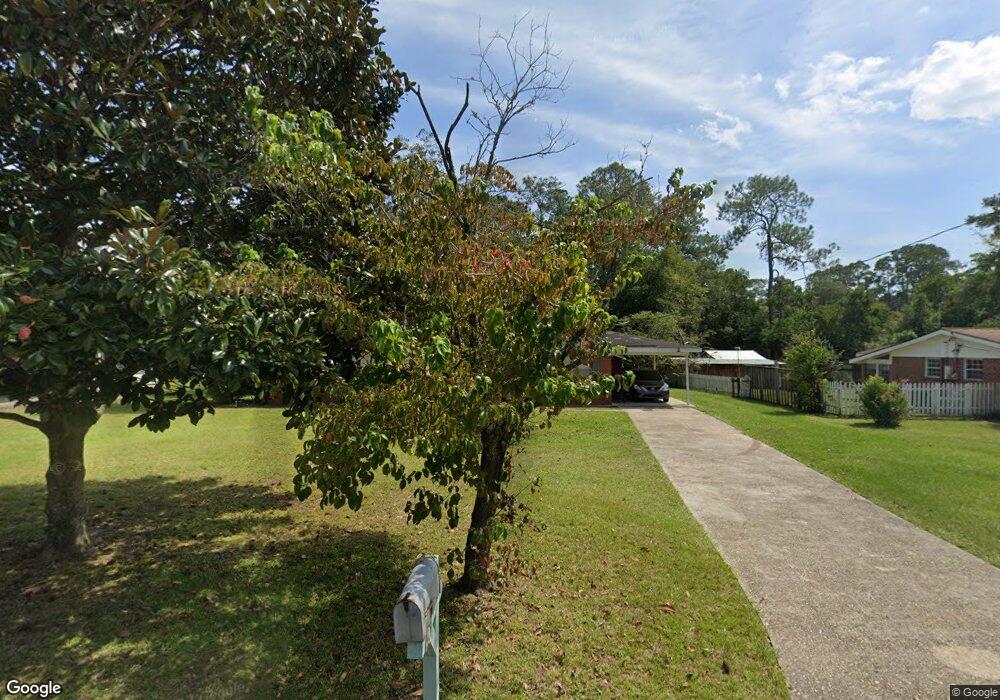
This home is located at 979 Seven Oaks Rd, Jesup, GA 31546 and is currently estimated at $159,667, approximately $115 per square foot. 979 Seven Oaks Rd is a home located in Wayne County with nearby schools including Jesup Elementary School, Arthur Williams Middle School, and Wayne County High School.
Ownership History
Date
Name
Owned For
Owner Type
Purchase Details
Closed on
Nov 15, 2017
Sold by
Roach Elizabeth Joann
Bought by
Rio Enterprises Llc
Current Estimated Value
Purchase Details
Closed on
Jun 12, 2014
Sold by
Pollard M Darryle
Bought by
Brooks Elizabeth Joann
Home Financials for this Owner
Home Financials are based on the most recent Mortgage that was taken out on this home.
Original Mortgage
$57,750
Interest Rate
4.23%
Mortgage Type
New Conventional
Purchase Details
Closed on
Jun 3, 2008
Sold by
Darryle Pollard M
Bought by
Pollard Shirley Ann
Home Financials for this Owner
Home Financials are based on the most recent Mortgage that was taken out on this home.
Original Mortgage
$67,000
Interest Rate
6.04%
Mortgage Type
New Conventional
Purchase Details
Closed on
Nov 1, 1986
Purchase Details
Closed on
Sep 1, 1969
Create a Home Valuation Report for This Property
The Home Valuation Report is an in-depth analysis detailing your home's value as well as a comparison with similar homes in the area
Home Values in the Area
Average Home Value in this Area
Purchase History
| Date | Buyer | Sale Price | Title Company |
|---|---|---|---|
| Rio Enterprises Llc | $58,000 | -- | |
| Brooks Elizabeth Joann | $57,750 | -- | |
| Pollard Shirley Ann | -- | -- | |
| -- | -- | -- | |
| -- | -- | -- |
Source: Public Records
Mortgage History
| Date | Status | Borrower | Loan Amount |
|---|---|---|---|
| Previous Owner | Brooks Elizabeth Joann | $57,750 | |
| Previous Owner | Pollard Shirley Ann | $67,000 |
Source: Public Records
Tax History Compared to Growth
Tax History
| Year | Tax Paid | Tax Assessment Tax Assessment Total Assessment is a certain percentage of the fair market value that is determined by local assessors to be the total taxable value of land and additions on the property. | Land | Improvement |
|---|---|---|---|---|
| 2024 | $1,075 | $35,149 | $3,400 | $31,749 |
| 2023 | $931 | $26,328 | $3,400 | $22,928 |
| 2022 | $829 | $26,328 | $3,400 | $22,928 |
| 2021 | $888 | $26,328 | $3,400 | $22,928 |
| 2020 | $918 | $26,328 | $3,400 | $22,928 |
| 2019 | $946 | $26,328 | $3,400 | $22,928 |
| 2018 | $833 | $26,328 | $3,400 | $22,928 |
| 2017 | $692 | $26,328 | $3,400 | $22,928 |
| 2016 | $788 | $26,328 | $3,400 | $22,928 |
| 2014 | $640 | $26,328 | $3,400 | $22,928 |
| 2013 | -- | $26,328 | $3,400 | $22,928 |
Source: Public Records
Map
Nearby Homes
- 985 Seven Oaks Rd
- 945 S Palm St
- 1101 S Palm St
- 805 Littlefield St
- 775 Catherine St
- 1300 S Palm St
- 50 Ac Hwy 301
- 0 S Palm St Unit 10609054
- 0 S Palm St Unit 1656795
- 655 Littlefield St
- 158 N Deborah Cir
- 123 Ivy St
- 00 U S 301
- 210 Purser Dr
- 1312 E Plum St
- 555 E Magnolia St
- 1816 S Palm St
- 1812 S Palm St
- 661 E Plum St
- 0 Us Hwy 341 Hwy S Unit 1651906
- 973 Seven Oaks Rd
- 302 Carlton Dr
- 300 Carlton Dr
- 967 Seven Oaks Rd
- 115 Stratford Rd
- 123 Stratford Rd
- 998 Seven Oaks Rd
- 186 Ritch Dr
- 110 Lynton Rd Unit 1
- 135 Stratford Rd
- 986 Seven Oaks Rd
- 150 Ritch Dr
- 1010 Seven Oaks Rd
- 961 Lynton Rd
- 974 Seven Oaks Rd
- 961 Seven Oaks Rd
- 107 Lynton Rd
- 303 Carlton Dr
- 993 S Palm St
- 305 Carlton Dr