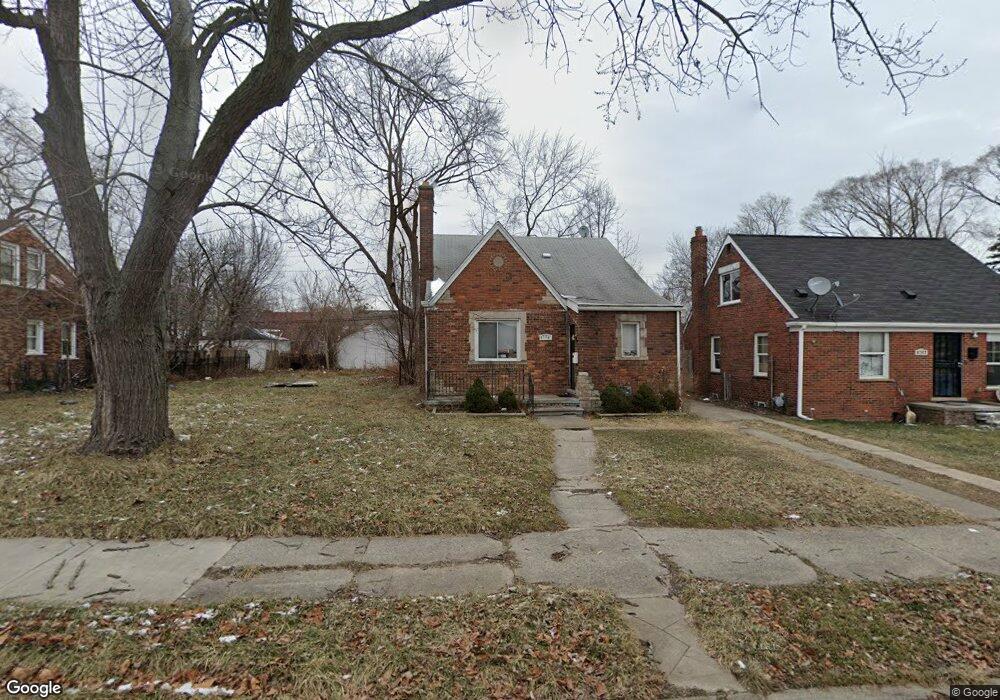
9790 Kensington Ave Detroit, MI 48224
Yorkshire Woods NeighborhoodEstimated Value: $72,000 - $96,000
3
Beds
2
Baths
1,300
Sq Ft
$67/Sq Ft
Est. Value
About This Home
This home is located at 9790 Kensington Ave, Detroit, MI 48224 and is currently estimated at $87,330, approximately $67 per square foot. 9790 Kensington Ave is a home located in Wayne County with nearby schools including Wayne Elementary School, Edward 'Duke' Ellington Conservatory of Music and Art, and Charles L. Spain Elementary-Middle School.
Ownership History
Date
Name
Owned For
Owner Type
Purchase Details
Closed on
Feb 28, 2022
Sold by
Detroit Resid Opportunity Fund
Bought by
Det Opportunities 2 Lp
Current Estimated Value
Purchase Details
Closed on
Sep 15, 2010
Sold by
Synergy Realty Llc
Bought by
Detroit Residential Opportunity Fund I L
Purchase Details
Closed on
Dec 9, 2009
Sold by
Dsouza Ronald and Dsouza Ron
Bought by
Synergy Realty Llc
Purchase Details
Closed on
May 15, 2008
Sold by
Green Point Mortgage Funding
Bought by
Gmac Mortgage Llc
Purchase Details
Closed on
Dec 13, 2006
Sold by
Herschberger Lavon and Herschberger Marie
Bought by
Greenpoint Mortgage Funding
Purchase Details
Closed on
Feb 8, 2005
Sold by
First Mortgage Fund Inc
Bought by
Herschberger Lavon
Purchase Details
Closed on
Oct 17, 2002
Sold by
Alston Eddie C
Bought by
Firstar Bank
Create a Home Valuation Report for This Property
The Home Valuation Report is an in-depth analysis detailing your home's value as well as a comparison with similar homes in the area
Home Values in the Area
Average Home Value in this Area
Purchase History
| Date | Buyer | Sale Price | Title Company |
|---|---|---|---|
| Det Opportunities 2 Lp | $554,500 | None Listed On Document | |
| Detroit Residential Opportunity Fund I L | -- | None Available | |
| Synergy Realty Llc | -- | Colonial Title Company | |
| Gmac Mortgage Llc | -- | Attorneys Title Agency Llc | |
| Greenpoint Mortgage Funding | $104,432 | None Available | |
| Herschberger Lavon | $125,000 | None Available | |
| Firstar Bank | $76,608 | -- |
Source: Public Records
Tax History Compared to Growth
Tax History
| Year | Tax Paid | Tax Assessment Tax Assessment Total Assessment is a certain percentage of the fair market value that is determined by local assessors to be the total taxable value of land and additions on the property. | Land | Improvement |
|---|---|---|---|---|
| 2025 | $2,093 | $33,600 | $0 | $0 |
| 2024 | $2,093 | $28,700 | $0 | $0 |
| 2023 | $2,034 | $23,300 | $0 | $0 |
| 2022 | $1,128 | $19,400 | $0 | $0 |
| 2021 | $1,099 | $13,500 | $0 | $0 |
| 2020 | $1,099 | $12,000 | $0 | $0 |
| 2019 | $1,083 | $10,400 | $0 | $0 |
| 2018 | $956 | $9,300 | $0 | $0 |
| 2017 | $180 | $9,500 | $0 | $0 |
| 2016 | $1,183 | $12,500 | $0 | $0 |
| 2015 | $1,057 | $12,500 | $0 | $0 |
| 2013 | $1,024 | $17,316 | $0 | $0 |
| 2010 | -- | $25,388 | $1,146 | $24,242 |
Source: Public Records
Map
Nearby Homes
- 9801 Kensington Ave
- 9969 Bishop St
- 9610 Whittier St
- 10253 Mckinney St
- 9510 Whittier St
- 10446 Balfour Rd
- 9257 Bishop St
- 9175 Everts St
- 10319 Mckinney St
- 10390 Somerset Ave
- 10172 Somerset Ave
- 10551 Somerset Ave
- 10508 Nottingham Rd
- 10468 Nottingham Rd
- 10024 Balfour Rd
- 10612 Nottingham Rd
- 9344 Courville St
- 10029 Balfour Rd
- 10595 Somerset Ave
- 10130 Somerset Ave
- 9782 Kensington Ave
- 9776 Kensington Ave
- 9798 Kensington Ave
- 9808 Kensington Ave
- 9766 Kensington Ave
- 9891 Yorkshire Rd
- 9814 Kensington Ave
- 9885 Yorkshire Rd
- 9758 Kensington Ave
- 9901 Yorkshire Rd Unit Bldg-Unit
- 9901 Yorkshire Rd
- 9875 Yorkshire Rd
- 9791 Kensington Ave
- 9785 Kensington Ave
- 9907 Yorkshire Rd
- 9824 Kensington Ave
- 9869 Yorkshire Rd
- 9811 Kensington Ave
- 9750 Kensington Ave
- 9819 S Yorksrire St S