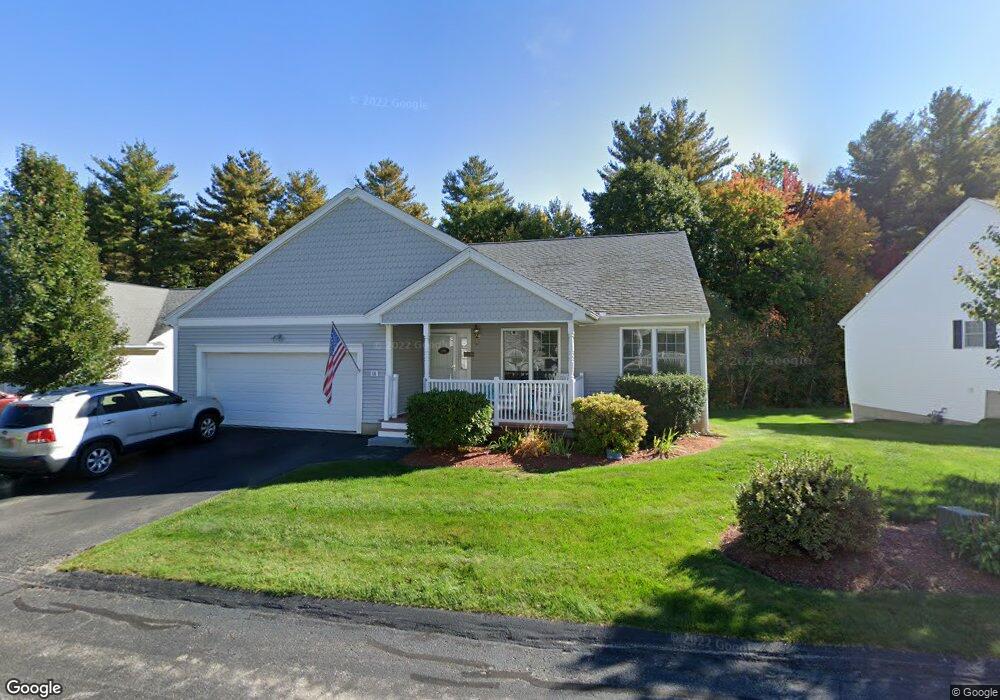
98 Apple Brook Way Unit 19 Manchester, NH 03109
Lower South Willow NeighborhoodEstimated Value: $413,083 - $537,000
2
Beds
2
Baths
1,612
Sq Ft
$305/Sq Ft
Est. Value
About This Home
This home is located at 98 Apple Brook Way Unit 19, Manchester, NH 03109 and is currently estimated at $491,021, approximately $304 per square foot. 98 Apple Brook Way Unit 19 is a home located in Hillsborough County with nearby schools including Henry J. McLaughlin Middle School and Manchester Memorial High School.
Ownership History
Date
Name
Owned For
Owner Type
Purchase Details
Closed on
Oct 8, 2021
Sold by
Maynard Roger A and Robidas-Maynard Rita M
Bought by
Maynard Ft and Maynard
Current Estimated Value
Home Financials for this Owner
Home Financials are based on the most recent Mortgage that was taken out on this home.
Original Mortgage
$233,210
Interest Rate
3.05%
Mortgage Type
New Conventional
Purchase Details
Closed on
Dec 16, 2019
Sold by
Marynard Ft and Maynard
Bought by
Maynard Roger A and Robidas-Maynard Rita M
Create a Home Valuation Report for This Property
The Home Valuation Report is an in-depth analysis detailing your home's value as well as a comparison with similar homes in the area
Home Values in the Area
Average Home Value in this Area
Purchase History
| Date | Buyer | Sale Price | Title Company |
|---|---|---|---|
| Maynard Ft | -- | None Available | |
| Maynard Ft | -- | None Available | |
| Maynard Roger A | -- | None Available | |
| Maynard Roger A | -- | None Available | |
| Maynard Roger A | -- | None Available | |
| Maynard Ft | -- | None Available |
Source: Public Records
Mortgage History
| Date | Status | Borrower | Loan Amount |
|---|---|---|---|
| Previous Owner | Maynard Roger A | $233,210 | |
| Previous Owner | Maynard Ft | $0 |
Source: Public Records
Tax History Compared to Growth
Tax History
| Year | Tax Paid | Tax Assessment Tax Assessment Total Assessment is a certain percentage of the fair market value that is determined by local assessors to be the total taxable value of land and additions on the property. | Land | Improvement |
|---|---|---|---|---|
| 2024 | $6,514 | $332,700 | $0 | $332,700 |
| 2023 | $6,275 | $332,700 | $0 | $332,700 |
| 2022 | $6,068 | $332,700 | $0 | $332,700 |
| 2021 | $5,882 | $332,700 | $0 | $332,700 |
| 2020 | $6,010 | $243,700 | $0 | $243,700 |
| 2019 | $5,927 | $243,700 | $0 | $243,700 |
| 2018 | $5,771 | $243,700 | $0 | $243,700 |
| 2017 | $5,683 | $243,700 | $0 | $243,700 |
| 2016 | $5,639 | $243,700 | $0 | $243,700 |
| 2015 | $5,466 | $233,200 | $0 | $233,200 |
| 2014 | $6,164 | $262,300 | $0 | $262,300 |
| 2013 | $5,946 | $262,300 | $0 | $262,300 |
Source: Public Records
Map
Nearby Homes
- 30 Bryant Rd
- 12 Forest Hill Way Unit 57
- 90 Forest Hill Way Unit 52
- 22 Eastmeadow Way
- 759 Cohas Ave
- 193 Morning Glory Dr
- 1901 Bodwell Rd Unit 28
- 195 Corning Rd
- 133 Corning Rd
- 1991 Bodwell Rd Unit 30
- 1029 S Mammoth Rd Unit 28
- 1035 S Mammoth Rd Unit 6
- 612 Megan Dr
- 628 Megan Dr
- 593 Cohas Ave
- 6a Walton Cir
- 10100 S Willow St Unit 214
- 10100 S Willow St Unit 101
- 10100 S Willow St Unit 109
- 10100 S Willow St Unit 207
- 88 Apple Brook Way Unit 20
- 114 Apple Brook Way Unit 18
- 95 Apple Brook Way Unit 3
- 107 Apple Brook Way Unit 4
- 126 Apple Brook Way Unit 17
- 117 Apple Brook Unit 5
- 117 Apple Brook Way Unit 5
- 127 Apple Brook Way Unit 6
- 134 Apple Brook Way Unit 16
- 135 Apple Brook Way Unit 7
- 144 Apple Brook Way Unit 15
- 34 Apple Brook Way Unit 21
- 161 Apple Brook Way Unit 8
- 160 Apple Brook Way Unit 14
- 21 Walden Way Unit 25
- 24 Apple Brook Way Unit 22
- 11 Walden Way Unit 24
- 31 Walden Way Unit 26
- 41 Walden Way Unit 27
- 41 Walden Way Unit 27