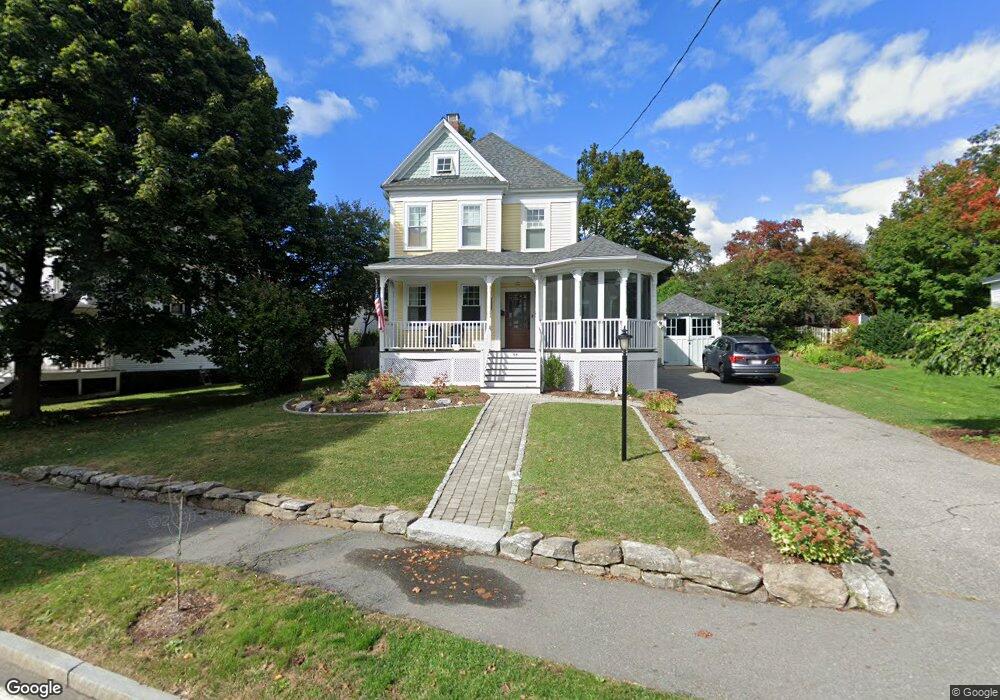
98 Chestnut St Andover, MA 01810
East Andover NeighborhoodEstimated Value: $962,000 - $1,168,000
3
Beds
2
Baths
1,854
Sq Ft
$589/Sq Ft
Est. Value
About This Home
This home is located at 98 Chestnut St, Andover, MA 01810 and is currently estimated at $1,092,115, approximately $589 per square foot. 98 Chestnut St is a home located in Essex County with nearby schools including Bancroft Elementary School, Doherty Middle School, and Andover High School.
Ownership History
Date
Name
Owned For
Owner Type
Purchase Details
Closed on
Mar 22, 2011
Sold by
Taylor Roscoe W and Taylor Teena R
Bought by
Castagna Caitlin Patrici and Castagna Brian Richard
Current Estimated Value
Purchase Details
Closed on
Oct 27, 2003
Sold by
Mcdonough Erin M and Ash James R
Bought by
Taylor Roscoe W and Taylor Teena R
Purchase Details
Closed on
Dec 2, 1994
Sold by
Whinn Walter J
Bought by
Ash James R
Create a Home Valuation Report for This Property
The Home Valuation Report is an in-depth analysis detailing your home's value as well as a comparison with similar homes in the area
Home Values in the Area
Average Home Value in this Area
Purchase History
| Date | Buyer | Sale Price | Title Company |
|---|---|---|---|
| Castagna Caitlin Patrici | $520,000 | -- | |
| Castagna Caitlin Patrici | $520,000 | -- | |
| Taylor Roscoe W | $489,900 | -- | |
| Taylor Roscoe W | $489,900 | -- | |
| Ash James R | $185,000 | -- | |
| Ash James R | $185,000 | -- |
Source: Public Records
Mortgage History
| Date | Status | Borrower | Loan Amount |
|---|---|---|---|
| Open | Ash James R | $411,000 | |
| Closed | Ash James R | $414,000 |
Source: Public Records
Tax History
| Year | Tax Paid | Tax Assessment Tax Assessment Total Assessment is a certain percentage of the fair market value that is determined by local assessors to be the total taxable value of land and additions on the property. | Land | Improvement |
|---|---|---|---|---|
| 2024 | $11,436 | $887,900 | $478,600 | $409,300 |
| 2023 | $10,932 | $800,300 | $431,000 | $369,300 |
| 2022 | $10,481 | $717,900 | $381,500 | $336,400 |
| 2021 | $10,026 | $655,700 | $346,800 | $308,900 |
| 2020 | $9,615 | $640,600 | $338,400 | $302,200 |
| 2019 | $9,461 | $619,600 | $325,200 | $294,400 |
| 2018 | $9,031 | $577,400 | $306,700 | $270,700 |
| 2017 | $8,636 | $568,900 | $300,600 | $268,300 |
| 2016 | $7,248 | $489,100 | $300,600 | $188,500 |
| 2015 | $7,236 | $483,400 | $289,200 | $194,200 |
Source: Public Records
Map
Nearby Homes
- 81 Chestnut St Unit 81
- 1 Stratford Rd
- 46 Whittier St
- 33 Chestnut St Unit 2
- 100.5 Main St Unit Q
- 96 N Main St Unit 3
- 154 Main St
- 36 High St
- 62 Carmel Rd
- 1 Sweeney Ct
- 22 Railroad St Unit 504
- 2 Powder Mill Square Unit 2B
- 52 Salem St
- 49 Salem St
- 11 Cuba St
- 3 Torr St
- 57 Salem St
- 70 Washington Park Dr Unit 6
- 40C Washington Park Dr Unit 12
- 181 High St Unit 1
Your Personal Tour Guide
Ask me questions while you tour the home.