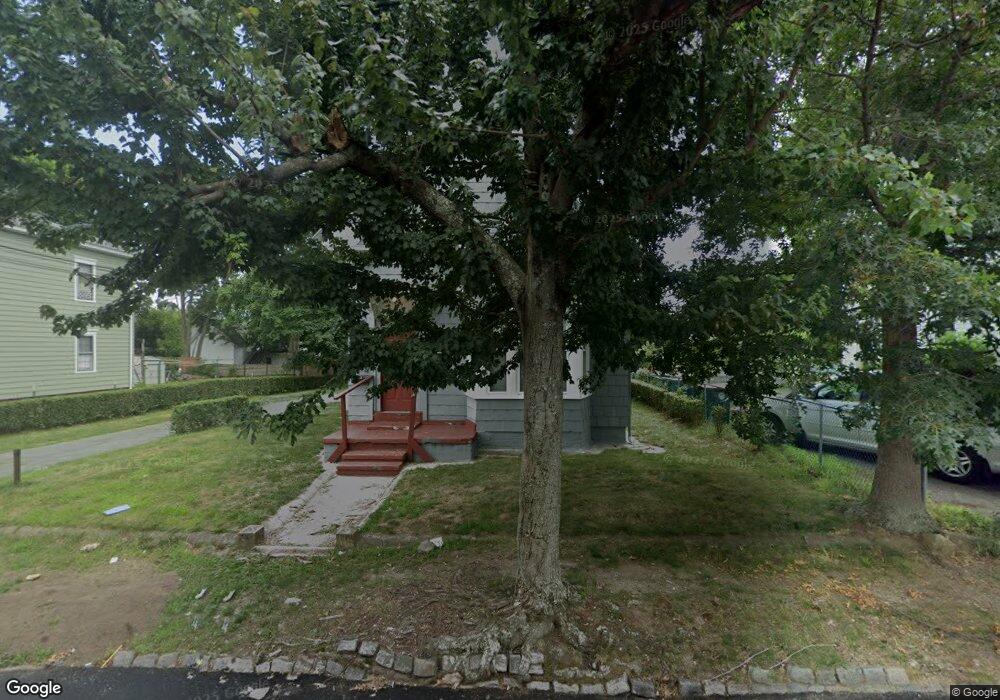
98 Florence St Brockton, MA 02301
Clifton Heights NeighborhoodEstimated Value: $576,575 - $745,000
4
Beds
2
Baths
1,992
Sq Ft
$336/Sq Ft
Est. Value
About This Home
This home is located at 98 Florence St, Brockton, MA 02301 and is currently estimated at $670,144, approximately $336 per square foot. 98 Florence St is a home located in Plymouth County with nearby schools including Gilmore Elementary School, John F. Kennedy Elementary School, and Davis K-8 School.
Ownership History
Date
Name
Owned For
Owner Type
Purchase Details
Closed on
Nov 10, 1997
Sold by
Brockton Community
Bought by
Defarias Joselino and Defarias Lindalva
Current Estimated Value
Purchase Details
Closed on
Nov 9, 1995
Sold by
Brockton Communty Corp
Bought by
Defarias Joselino and Defarias Lindalva
Purchase Details
Closed on
Mar 24, 1995
Sold by
Department Of Housing & Urban Dev
Bought by
Brockton Comm Corp
Purchase Details
Closed on
Jan 5, 1994
Sold by
Norwest Mtg Inc
Bought by
Department Of Housing & Urban Dev
Purchase Details
Closed on
Dec 2, 1993
Sold by
Figueroa Thomasita and Isales Hector L
Bought by
Norwest Mtg Inc
Purchase Details
Closed on
Aug 20, 1991
Sold by
Pearson John R
Bought by
Figueroa Tomasita and Isales Hector L
Create a Home Valuation Report for This Property
The Home Valuation Report is an in-depth analysis detailing your home's value as well as a comparison with similar homes in the area
Home Values in the Area
Average Home Value in this Area
Purchase History
| Date | Buyer | Sale Price | Title Company |
|---|---|---|---|
| Defarias Joselino | $80,000 | -- | |
| Defarias Joselino | $80,000 | -- | |
| Defarias Joselino | $80,000 | -- | |
| Defarias Joselino | $80,000 | -- | |
| Brockton Comm Corp | $1,000 | -- | |
| Brockton Comm Corp | $1,000 | -- | |
| Department Of Housing & Urban Dev | $132,967 | -- | |
| Norwest Mtg Inc | $132,967 | -- | |
| Figueroa Tomasita | $104,000 | -- |
Source: Public Records
Mortgage History
| Date | Status | Borrower | Loan Amount |
|---|---|---|---|
| Open | Figueroa Tomasita | $172,000 | |
| Closed | Figueroa Tomasita | $100,000 |
Source: Public Records
Tax History
| Year | Tax Paid | Tax Assessment Tax Assessment Total Assessment is a certain percentage of the fair market value that is determined by local assessors to be the total taxable value of land and additions on the property. | Land | Improvement |
|---|---|---|---|---|
| 2025 | $6,862 | $566,600 | $140,200 | $426,400 |
| 2024 | $6,726 | $559,600 | $140,200 | $419,400 |
| 2023 | $6,092 | $469,300 | $104,800 | $364,500 |
| 2022 | $6,108 | $437,200 | $95,200 | $342,000 |
| 2021 | $5,539 | $382,000 | $79,200 | $302,800 |
| 2020 | $4,939 | $326,000 | $74,100 | $251,900 |
| 2019 | $4,807 | $309,300 | $72,300 | $237,000 |
| 2018 | $4,336 | $270,000 | $72,300 | $197,700 |
| 2017 | $3,977 | $247,000 | $72,300 | $174,700 |
| 2016 | $3,837 | $221,000 | $70,100 | $150,900 |
| 2015 | $3,122 | $172,000 | $70,100 | $101,900 |
| 2014 | $3,165 | $174,600 | $70,100 | $104,500 |
Source: Public Records
Map
Nearby Homes
- 94 Florence St
- 104 Florence St
- 104 Florence St Unit 2
- 35 Packard Way
- 88 Florence St
- 108 Florence St
- 108 Florence St Unit 1
- 47 Packard Way
- 27 Packard Way
- 97 Florence St
- 99 Florence St
- 95 Florence St
- 91 Florence St
- 82 Florence St
- 82 Florence St Unit 2
- 112 Florence St
- 107 Florence St
- 15 Packard Way
- 87 Florence St
- 55 Packard Way
Your Personal Tour Guide
Ask me questions while you tour the home.