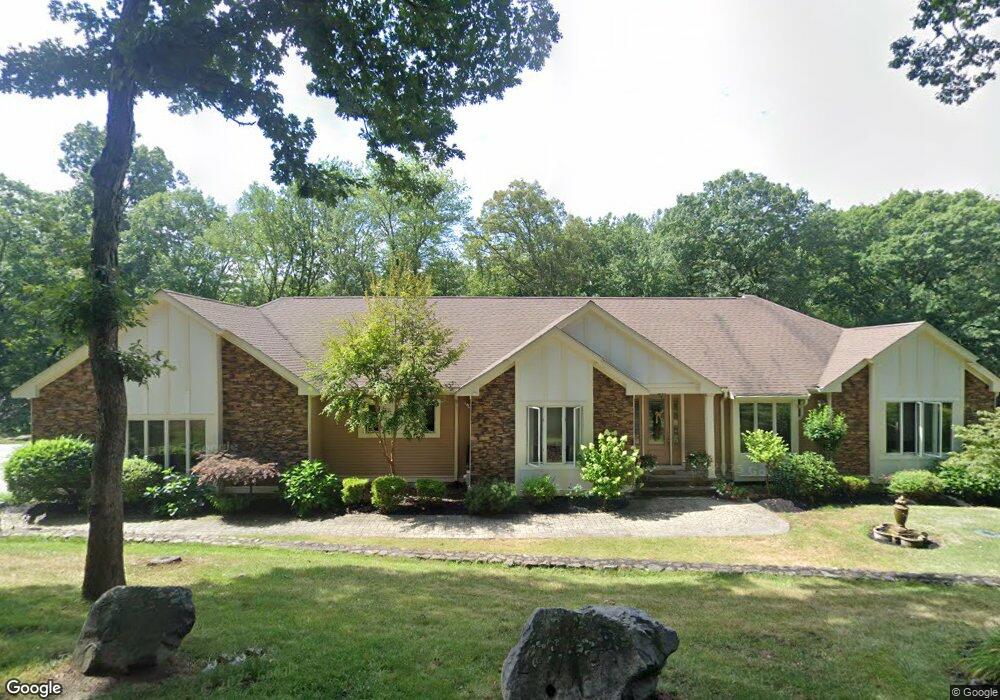
98 River St Middleton, MA 01949
Estimated Value: $1,176,000 - $1,277,000
6
Beds
4
Baths
2,912
Sq Ft
$427/Sq Ft
Est. Value
About This Home
This home is located at 98 River St, Middleton, MA 01949 and is currently estimated at $1,243,474, approximately $427 per square foot. 98 River St is a home located in Essex County with nearby schools including Howe-Manning Elementary School, Fuller Meadow Elementary School, and Masconomet Regional Middle School.
Ownership History
Date
Name
Owned For
Owner Type
Purchase Details
Closed on
Dec 11, 2023
Sold by
Berardino Arthur F and Berardino Lillian
Bought by
Berardino Ft and Berardino
Current Estimated Value
Purchase Details
Closed on
Jan 23, 2006
Sold by
Emerson Woods Rt and Schank Thomas
Bought by
Berardino Arthur
Create a Home Valuation Report for This Property
The Home Valuation Report is an in-depth analysis detailing your home's value as well as a comparison with similar homes in the area
Home Values in the Area
Average Home Value in this Area
Purchase History
| Date | Buyer | Sale Price | Title Company |
|---|---|---|---|
| Berardino Ft | -- | None Available | |
| Berardino Ft | -- | None Available | |
| Berardino Ft | -- | None Available | |
| Berardino Ft | -- | None Available | |
| Berardino Arthur | $367,200 | -- | |
| Berardino Arthur | $367,200 | -- |
Source: Public Records
Mortgage History
| Date | Status | Borrower | Loan Amount |
|---|---|---|---|
| Previous Owner | Berardino Arthur | $307,500 | |
| Previous Owner | Berardino Arthur | $330,000 | |
| Previous Owner | Berardino Arthur | $265,000 |
Source: Public Records
Tax History
| Year | Tax Paid | Tax Assessment Tax Assessment Total Assessment is a certain percentage of the fair market value that is determined by local assessors to be the total taxable value of land and additions on the property. | Land | Improvement |
|---|---|---|---|---|
| 2025 | $13,069 | $1,099,200 | $345,400 | $753,800 |
| 2024 | $13,009 | $1,103,400 | $345,400 | $758,000 |
| 2023 | $14,776 | $1,148,100 | $345,400 | $802,700 |
| 2022 | $10,183 | $768,500 | $311,200 | $457,300 |
| 2021 | $10,081 | $734,800 | $277,200 | $457,600 |
| 2020 | $9,523 | $699,200 | $253,200 | $446,000 |
| 2019 | $9,260 | $676,400 | $261,200 | $415,200 |
| 2018 | $8,732 | $625,500 | $257,200 | $368,300 |
| 2017 | $8,702 | $623,800 | $227,200 | $396,600 |
| 2016 | $8,171 | $588,300 | $197,200 | $391,100 |
| 2015 | $7,401 | $537,100 | $201,200 | $335,900 |
Source: Public Records
Map
Nearby Homes
- 1 Couture Way
- 12 Couture Way
- 19 Peachey Cir
- 40 Glen Dr
- 31 Styles Dr
- 37 Peaslee Cir Unit 37
- 20 Bellingham Ct
- 67 Fuller Pond Rd
- 1 Mills Point Unit 1
- 6 Greystone Dr
- 6 White Ln
- 35 Catherine Dr
- 8 Temi Rd
- 20 Mid Iron Dr Unit 20
- 360 Andover St Unit 1310
- 1466 Main St
- 9 Stableford Ct Unit 9
- 5 Stableford Ct Unit 11
- 7 Pinewood Rd
- 19 Fairway Ln Unit 53
Your Personal Tour Guide
Ask me questions while you tour the home.