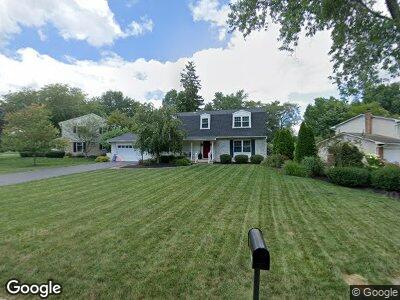
980 Colony Way Columbus, OH 43235
Estimated Value: $572,593 - $640,000
4
Beds
3
Baths
2,539
Sq Ft
$244/Sq Ft
Est. Value
About This Home
This home is located at 980 Colony Way, Columbus, OH 43235 and is currently estimated at $618,898, approximately $243 per square foot. 980 Colony Way is a home located in Franklin County with nearby schools including Worthington Hills Elementary School, McCord Middle School, and Worthington Kilbourne High School.
Ownership History
Date
Name
Owned For
Owner Type
Purchase Details
Closed on
May 24, 2011
Sold by
Ussery Karol Yvonne
Bought by
Bonarrigo Anthony J and Bonarrigo Elizabeth N
Current Estimated Value
Home Financials for this Owner
Home Financials are based on the most recent Mortgage that was taken out on this home.
Original Mortgage
$225,600
Interest Rate
4.8%
Mortgage Type
New Conventional
Purchase Details
Closed on
Oct 28, 2010
Sold by
Vey William C and Ussery Karol Yvonne
Bought by
Ussery Karol Yvonne
Purchase Details
Closed on
Oct 26, 2007
Sold by
Vey William C and Ussery Karol Yvonne
Bought by
Vey William C and Ussery Karol Yvonne
Purchase Details
Closed on
Feb 17, 2005
Sold by
Vey Joan J and Vey William C
Bought by
Vey William C
Purchase Details
Closed on
Aug 15, 1968
Bought by
Vey William C and Vey Joan J
Create a Home Valuation Report for This Property
The Home Valuation Report is an in-depth analysis detailing your home's value as well as a comparison with similar homes in the area
Home Values in the Area
Average Home Value in this Area
Purchase History
| Date | Buyer | Sale Price | Title Company |
|---|---|---|---|
| Bonarrigo Anthony J | $282,000 | Real Living | |
| Vey William C | -- | Attorney | |
| Vey William C | -- | -- |
Source: Public Records
Mortgage History
| Date | Status | Borrower | Loan Amount |
|---|---|---|---|
| Open | Bonarrigo Anthony S | $250,000 | |
| Closed | Bonarrigo Anthony J | $233,000 | |
| Closed | Bonarrigo Anthony J | $73,600 | |
| Closed | Bonarrigo Anthony J | $216,000 | |
| Closed | Bonarrigo Anthony J | $225,600 | |
| Closed | Bonarrigo Anthony J | $225,600 |
Source: Public Records
Tax History Compared to Growth
Tax History
| Year | Tax Paid | Tax Assessment Tax Assessment Total Assessment is a certain percentage of the fair market value that is determined by local assessors to be the total taxable value of land and additions on the property. | Land | Improvement |
|---|---|---|---|---|
| 2024 | $12,256 | $160,160 | $49,000 | $111,160 |
| 2023 | $10,607 | $160,160 | $49,000 | $111,160 |
| 2022 | $10,613 | $125,310 | $34,270 | $91,040 |
| 2021 | $9,893 | $125,310 | $34,270 | $91,040 |
| 2020 | $9,606 | $125,310 | $34,270 | $91,040 |
| 2019 | $9,033 | $104,720 | $28,560 | $76,160 |
| 2018 | $8,379 | $104,720 | $28,560 | $76,160 |
| 2017 | $8,099 | $104,720 | $28,560 | $76,160 |
| 2016 | $7,954 | $92,610 | $18,060 | $74,550 |
| 2015 | $7,955 | $92,610 | $18,060 | $74,550 |
| 2014 | $7,623 | $92,610 | $18,060 | $74,550 |
| 2013 | $3,475 | $84,175 | $16,415 | $67,760 |
Source: Public Records
Map
Nearby Homes
- 1018 Rutherglen Dr
- 1068 Rutherglen Dr
- 7731 Sefton Park Dr
- 1042 Circle On the Green
- 825 Bluffview Dr
- 8121 Blind Brook Ct
- 1133 Blind Brook Dr
- 833 Bluffway Dr
- 1192 Tessier Dr
- 1539 Clubview Blvd S
- 1336 Hickory Ridge Ln
- 796 Mulberry Dr
- 1711 Twin Oaks Dr
- 7847 Maplecreek Ct
- 8280 Waco Ln
- 8200 Markhaven Dr
- 1546 Oakview Dr
- 1474 Dogwood Loop
- 1379 Red Bud Ct
- 1836 Birchfield Ct
- 980 Colony Way
- 956 Colony Way
- 1000 Colony Way
- 948 Colony Way
- 1001 Clubview Blvd S
- 979 Colony Way
- 1013 Clubview Blvd S
- 985 Colony Way
- 999 Colony Way
- 995 Clubview Blvd S
- 955 Colony Way
- 936 Colony Way
- 1011 Colony Way
- 943 Longview Ct
- 983 Clubview Blvd S
- 949 Colony Way
- 1017 Colony Way
- 924 Colony Way
- 937 Colony Way
- 962 Cherryfield Ave