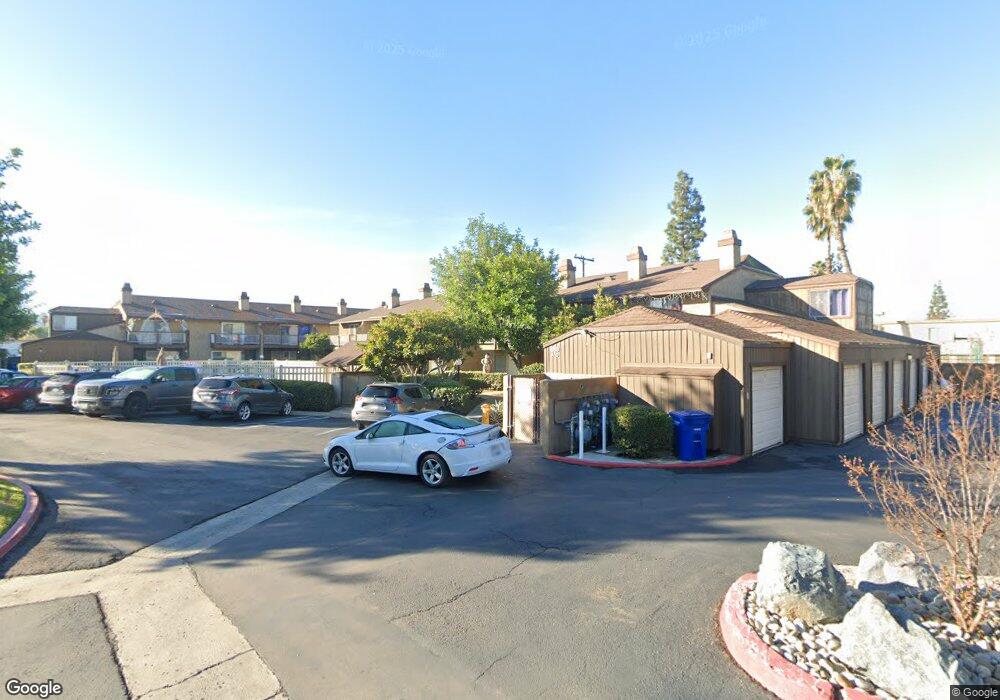
980 E Main St Unit C El Cajon, CA 92021
Estimated Value: $495,700 - $539,000
2
Beds
3
Baths
1,360
Sq Ft
$385/Sq Ft
Est. Value
About This Home
This home is located at 980 E Main St Unit C, El Cajon, CA 92021 and is currently estimated at $523,425, approximately $384 per square foot. 980 E Main St Unit C is a home located in San Diego County with nearby schools including Naranca Elementary School, Cajon Valley Middle School, and El Cajon Valley High School.
Ownership History
Date
Name
Owned For
Owner Type
Purchase Details
Closed on
Aug 9, 2001
Sold by
Johnson Erlinda C and Johnson Mary Jane
Bought by
Eues Melody Theresa
Current Estimated Value
Home Financials for this Owner
Home Financials are based on the most recent Mortgage that was taken out on this home.
Original Mortgage
$136,000
Outstanding Balance
$52,821
Interest Rate
7.09%
Mortgage Type
Purchase Money Mortgage
Estimated Equity
$470,604
Purchase Details
Closed on
Aug 14, 1998
Sold by
Johnson Erlinda C
Bought by
Johnson Erlinda C and Johnson Mary Jane
Home Financials for this Owner
Home Financials are based on the most recent Mortgage that was taken out on this home.
Original Mortgage
$89,850
Interest Rate
6.92%
Mortgage Type
Purchase Money Mortgage
Purchase Details
Closed on
Apr 12, 1991
Create a Home Valuation Report for This Property
The Home Valuation Report is an in-depth analysis detailing your home's value as well as a comparison with similar homes in the area
Purchase History
| Date | Buyer | Sale Price | Title Company |
|---|---|---|---|
| Eues Melody Theresa | $156,000 | Old Republic Title Company | |
| Johnson Erlinda C | -- | -- | |
| Johnson Erlinda C | $100,000 | Fidelity National Title Ins | |
| -- | $100,000 | -- |
Source: Public Records
Mortgage History
| Date | Status | Borrower | Loan Amount |
|---|---|---|---|
| Open | Eues Melody Theresa | $136,000 | |
| Previous Owner | Johnson Erlinda C | $89,850 | |
| Closed | Eues Melody Theresa | $25,000 |
Source: Public Records
Tax History
| Year | Tax Paid | Tax Assessment Tax Assessment Total Assessment is a certain percentage of the fair market value that is determined by local assessors to be the total taxable value of land and additions on the property. | Land | Improvement |
|---|---|---|---|---|
| 2025 | $2,674 | $230,443 | $72,921 | $157,522 |
| 2024 | $2,674 | $225,926 | $71,492 | $154,434 |
| 2023 | $2,603 | $221,497 | $70,091 | $151,406 |
| 2022 | $2,561 | $217,155 | $68,717 | $148,438 |
| 2021 | $2,524 | $212,898 | $67,370 | $145,528 |
| 2020 | $2,496 | $210,716 | $66,680 | $144,036 |
| 2019 | $2,464 | $206,585 | $65,373 | $141,212 |
| 2018 | $2,423 | $202,536 | $64,092 | $138,444 |
| 2017 | $2,390 | $198,566 | $62,836 | $135,730 |
| 2016 | $2,294 | $194,673 | $61,604 | $133,069 |
| 2015 | $2,281 | $191,750 | $60,679 | $131,071 |
| 2014 | $2,138 | $180,000 | $63,000 | $117,000 |
Source: Public Records
Map
Nearby Homes
- 988 E Main St Unit B
- 998 E Main St Unit 50
- 2002 Penny Ln
- 1036 E Main St
- 150 S Anza St Unit 69
- 1702 Jacob Ct
- 166 N 1st St Unit 23
- 390 N 1st St Unit 23
- 732 E Lexington Ave Unit 19
- 359 N 1st St
- 521 N Mollison Ave
- 522 Mary Ln
- 438 S Anza St
- 480 S Anza St
- 357 S 1st St
- 1174 E Main St Unit 62
- 1174 E Main St
- 1174 E Main St Unit 103
- 300 Roanoke Rd Unit 14
- 1170 Decker St Unit D
- 990 E Main St Unit E
- 982 E Main St Unit E
- 988 E Main St Unit F
- 978 E Main St Unit D
- 988 E Main St Unit 19
- 980 E Main St Unit A
- 980 E Main St Unit B
- 980 E Main St Unit D
- 980 E Main St
- 980 E Main St Unit F
- 980 E Main St Unit G
- 990 E Main St Unit B
- 990 E Main St Unit C
- 990 E Main St Unit D
- 990 E Main St
- 978 E Main St Unit A
- 978 E Main St Unit B
- 978 E Main St Unit C
- 978 E Main St
- 978 E Main St Unit F
Your Personal Tour Guide
Ask me questions while you tour the home.