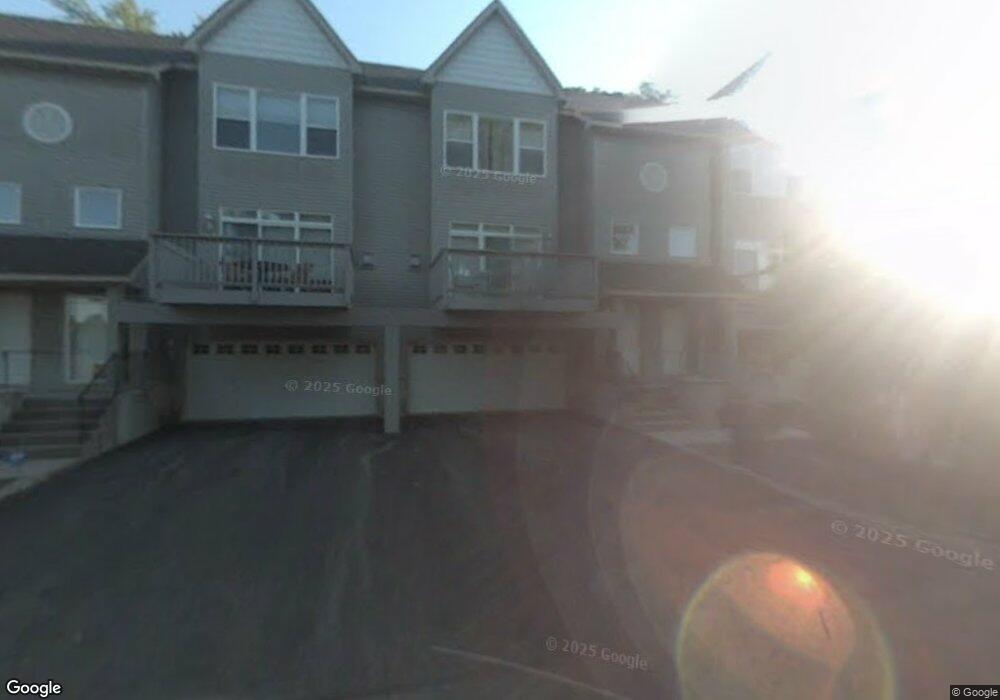
9800 Cove Dr Unit 9800 Hopkins, MN 55305
Estimated Value: $393,000 - $528,000
3
Beds
3
Baths
1,875
Sq Ft
$243/Sq Ft
Est. Value
About This Home
This home is located at 9800 Cove Dr Unit 9800, Hopkins, MN 55305 and is currently estimated at $455,079, approximately $242 per square foot. 9800 Cove Dr Unit 9800 is a home located in Hennepin County with nearby schools including L.H. Tanglen Elementary School, Hopkins North Junior High School, and Hopkins Senior High School.
Ownership History
Date
Name
Owned For
Owner Type
Purchase Details
Closed on
Mar 16, 2019
Sold by
Eng Michelle C
Bought by
Jurado Eng Michelle C and Jurado Toledo Novelli
Current Estimated Value
Purchase Details
Closed on
Mar 10, 2017
Sold by
Koehler Tami R and Koehler Bruce J
Bought by
Eng Michelle C
Home Financials for this Owner
Home Financials are based on the most recent Mortgage that was taken out on this home.
Original Mortgage
$330,000
Interest Rate
4.19%
Mortgage Type
New Conventional
Purchase Details
Closed on
Jul 1, 2015
Sold by
Malone Thomas Thomas
Bought by
Koehler Bruce Bruce
Home Financials for this Owner
Home Financials are based on the most recent Mortgage that was taken out on this home.
Original Mortgage
$208,000
Interest Rate
4.02%
Purchase Details
Closed on
Feb 16, 2001
Sold by
Maplewood Development & Construction Inc
Bought by
Malone Thomas P and Crawford Kathryn L
Create a Home Valuation Report for This Property
The Home Valuation Report is an in-depth analysis detailing your home's value as well as a comparison with similar homes in the area
Home Values in the Area
Average Home Value in this Area
Purchase History
| Date | Buyer | Sale Price | Title Company |
|---|---|---|---|
| Jurado Eng Michelle C | -- | None Available | |
| Eng Michelle C | $330,000 | Title Nexus Llc | |
| Koehler Bruce Bruce | $260,000 | -- | |
| Malone Thomas P | $289,900 | -- |
Source: Public Records
Mortgage History
| Date | Status | Borrower | Loan Amount |
|---|---|---|---|
| Previous Owner | Eng Michelle C | $330,000 | |
| Previous Owner | Koehler Bruce Bruce | $208,000 |
Source: Public Records
Tax History Compared to Growth
Tax History
| Year | Tax Paid | Tax Assessment Tax Assessment Total Assessment is a certain percentage of the fair market value that is determined by local assessors to be the total taxable value of land and additions on the property. | Land | Improvement |
|---|---|---|---|---|
| 2024 | $4,689 | $392,500 | $82,000 | $310,500 |
| 2023 | $4,289 | $366,600 | $82,000 | $284,600 |
| 2022 | $4,070 | $342,500 | $82,000 | $260,500 |
| 2021 | $3,906 | $330,000 | $75,000 | $255,000 |
| 2020 | $4,098 | $321,400 | $75,000 | $246,400 |
| 2019 | $4,304 | $319,700 | $75,000 | $244,700 |
| 2018 | $3,918 | $336,900 | $75,000 | $261,900 |
| 2017 | $3,777 | $285,800 | $60,000 | $225,800 |
| 2016 | $4,110 | $300,300 | $60,000 | $240,300 |
| 2015 | $3,783 | $273,200 | $60,000 | $213,200 |
| 2014 | -- | $237,700 | $60,000 | $177,700 |
Source: Public Records
Map
Nearby Homes
- 9816 Cove Dr
- 2600 Cedar Green
- 10211 Cedar Lake Rd Unit 208
- 10211 Cedar Lake Rd Unit 109
- 10211 Cedar Lake Rd Unit 204
- 10301 Cedar Lake Rd Unit 113
- 10411 Cedar Lake Rd Unit 301
- 2524 Birchview Ln
- 10401 Cedar Lake Rd Unit 201
- 10411 Cedar Lake Rd S Unit 213
- 2528 Birchview Ln
- 10501 Cedar Lake Rd Unit 212
- 10501 Cedar Lake Rd Unit 414
- 10501 Cedar Lake Rd Unit 404
- 10501 Cedar Lake Rd Unit 206
- 10501 Cedar Lake Rd Unit 420
- 2515 Royals Dr
- 10441 Greenbrier Rd Unit 315
- 10441 Greenbrier Rd Unit 303
- 10451 Greenbrier Rd Unit 316
- 9828 Cove Dr Unit 9828
- 9824 Cove Dr
- 9820 Cove Dr
- 9812 Cove Dr
- 9808 Cove Dr
- 9804 Cove Dr
- 2654 Cedar Crest Rd W
- 2641 Cedar Crest Rd W
- 2626 Cedar Crest Rd E
- 2642 Cedar Crest Rd W
- 2630 Cedar Crest Rd E
- 2635 Cedar Crest Rd W
- 2828 Jordan Ave S
- 2828-2875 Jordan Ave
- 2636 Cedar Crest Rd W
- 2622 Cedar Crest Rd E
- 2631 Cedar Crest Rd W
- 10022 Cove Dr Unit 10022
- 2638 Cedar Crest Rd E
- 10010 Cove Dr