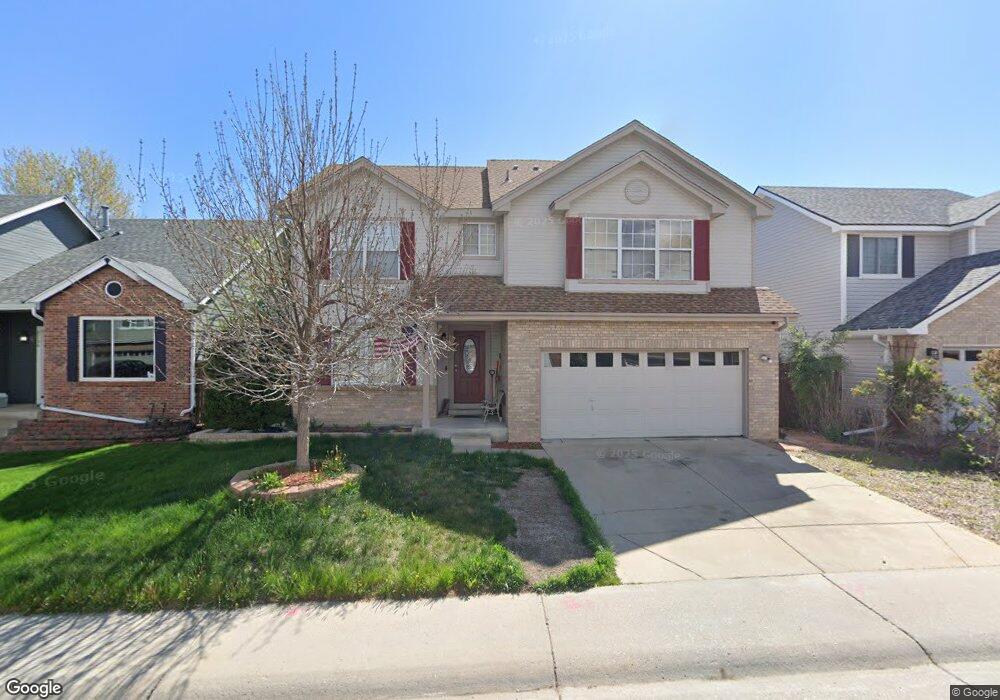
9800 Rock Dove Ln Highlands Ranch, CO 80129
Westridge NeighborhoodEstimated Value: $629,000 - $668,000
4
Beds
4
Baths
2,197
Sq Ft
$292/Sq Ft
Est. Value
About This Home
This home is located at 9800 Rock Dove Ln, Highlands Ranch, CO 80129 and is currently estimated at $641,950, approximately $292 per square foot. 9800 Rock Dove Ln is a home located in Douglas County with nearby schools including Trailblazer Elementary School, Ranch View Middle School, and Thunderridge High School.
Ownership History
Date
Name
Owned For
Owner Type
Purchase Details
Closed on
Nov 13, 2007
Sold by
Deherrera Lana J and Deherrera Arvin R
Bought by
Deherrera Arvin
Current Estimated Value
Purchase Details
Closed on
Apr 27, 2001
Sold by
Shelton Robert M and Shelton Sheryl K
Bought by
Deherrera Lana J and Deherrera Arvin R
Home Financials for this Owner
Home Financials are based on the most recent Mortgage that was taken out on this home.
Original Mortgage
$231,369
Outstanding Balance
$84,985
Interest Rate
6.81%
Mortgage Type
FHA
Estimated Equity
$556,965
Purchase Details
Closed on
Jul 31, 1990
Sold by
Village Homes Ltd
Bought by
Shelton Robert M and Shelton Sheryl K
Purchase Details
Closed on
Jun 21, 1990
Sold by
Mission Viejo Co
Bought by
Bellcourt Inc & Centex Real Estate & Fal
Purchase Details
Closed on
Apr 26, 1990
Sold by
Mission Viejo Co
Bought by
Village Homes Ltd
Create a Home Valuation Report for This Property
The Home Valuation Report is an in-depth analysis detailing your home's value as well as a comparison with similar homes in the area
Home Values in the Area
Average Home Value in this Area
Purchase History
| Date | Buyer | Sale Price | Title Company |
|---|---|---|---|
| Deherrera Arvin | -- | None Available | |
| Deherrera Lana J | $235,000 | -- | |
| Shelton Robert M | $117,400 | -- | |
| Bellcourt Inc & Centex Real Estate & Fal | -- | -- | |
| Village Homes Ltd | $51,700 | -- |
Source: Public Records
Mortgage History
| Date | Status | Borrower | Loan Amount |
|---|---|---|---|
| Open | Deherrera Lana J | $231,369 |
Source: Public Records
Tax History Compared to Growth
Tax History
| Year | Tax Paid | Tax Assessment Tax Assessment Total Assessment is a certain percentage of the fair market value that is determined by local assessors to be the total taxable value of land and additions on the property. | Land | Improvement |
|---|---|---|---|---|
| 2024 | $3,793 | $43,930 | $9,060 | $34,870 |
| 2023 | $3,786 | $43,930 | $9,060 | $34,870 |
| 2022 | $2,947 | $32,260 | $6,240 | $26,020 |
| 2021 | $3,066 | $32,260 | $6,240 | $26,020 |
| 2020 | $2,876 | $31,010 | $5,910 | $25,100 |
| 2019 | $2,887 | $31,010 | $5,910 | $25,100 |
| 2018 | $2,532 | $26,790 | $5,210 | $21,580 |
| 2017 | $2,305 | $26,790 | $5,210 | $21,580 |
| 2016 | $2,156 | $24,590 | $4,410 | $20,180 |
| 2015 | $2,202 | $24,590 | $4,410 | $20,180 |
| 2014 | $1,944 | $20,040 | $4,540 | $15,500 |
Source: Public Records
Map
Nearby Homes
- 9821 Rock Dove Ln
- 3644 Rosewalk Cir
- 9711 Bucknell Way
- 3641 Rosewalk Cir
- 10054 Deer Creek St
- 9755 Spring Hill St
- 9488 S Hackberry Ln
- 9477 S Hackberry Ln
- 9409 S Hackberry Ln
- 2841 High Cliffe Place
- 10347 Woodrose Ln
- 1993 Mountain Maple Ave
- 9227 Gold Lace Place
- 9178 Gold Lace Place
- 2174 Cactus Bluff Ave
- 10505 Hyacinth Place
- 2590 W Bitterroot Place
- 2572 W Bitterroot Place
- 2627 Baneberry Ln
- 2596 Bitterroot Place
- 9804 Rock Dove Ln
- 9796 Rock Dove Ln
- 9811 Goldfinch Ln
- 9815 Goldfinch Ln
- 9792 Rock Dove Ln
- 9808 Rock Dove Ln
- 9807 Goldfinch Ln
- 9819 Goldfinch Ln
- 9801 Rock Dove Ln
- 9805 Rock Dove Ln
- 9797 Rock Dove Ln
- 9803 Goldfinch Ln
- 9788 Rock Dove Ln
- 9825 Goldfinch Ln
- 9793 Rock Dove Ln
- 9809 Rock Dove Ln
- 9835 Goldfinch Ln
- 9799 Goldfinch Ln
- 9784 Rock Dove Ln
- 9813 Rock Dove Ln