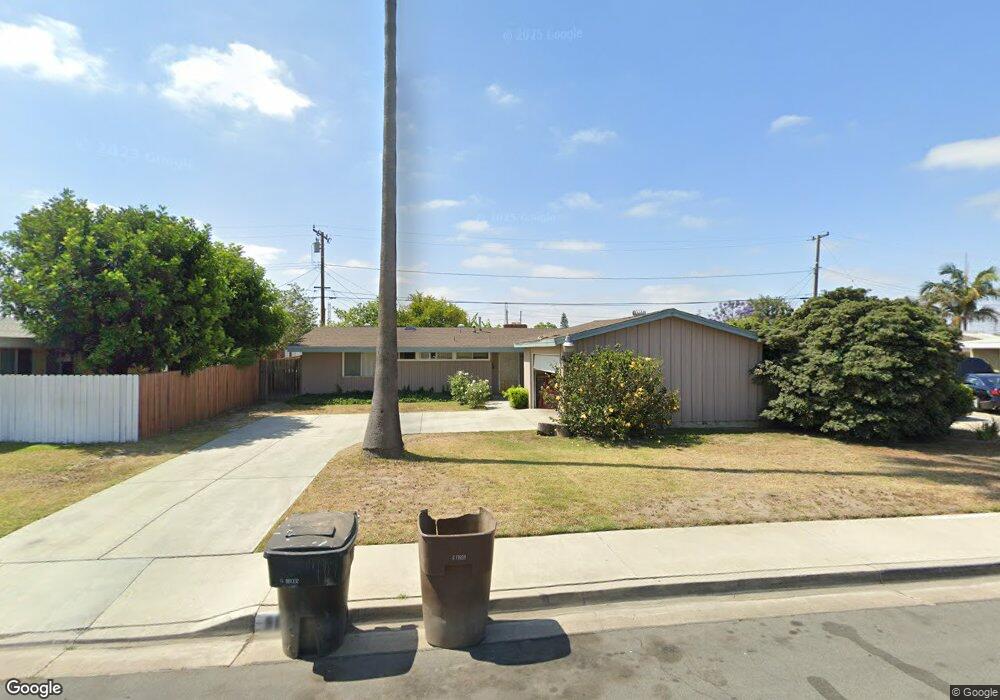
9802 Lullaby Ln Anaheim, CA 92804
West Anaheim NeighborhoodEstimated Value: $915,536 - $1,072,000
4
Beds
2
Baths
1,200
Sq Ft
$821/Sq Ft
Est. Value
About This Home
This home is located at 9802 Lullaby Ln, Anaheim, CA 92804 and is currently estimated at $985,634, approximately $821 per square foot. 9802 Lullaby Ln is a home located in Orange County with nearby schools including Jonas E. Salk Elementary School, Dale Jr High School, and Magnolia High.
Ownership History
Date
Name
Owned For
Owner Type
Purchase Details
Closed on
Oct 21, 2021
Sold by
Dang Chau and Truong Tommy
Bought by
Truong Tommy
Current Estimated Value
Purchase Details
Closed on
Apr 7, 2021
Sold by
Dang Chau
Bought by
Dang Chau
Purchase Details
Closed on
Nov 21, 2011
Sold by
Truong Michelle
Bought by
Dang Chau
Home Financials for this Owner
Home Financials are based on the most recent Mortgage that was taken out on this home.
Original Mortgage
$160,000
Outstanding Balance
$63,708
Interest Rate
4.06%
Mortgage Type
New Conventional
Estimated Equity
$921,926
Purchase Details
Closed on
May 20, 2010
Sold by
Inymac Inc
Bought by
Dang Chau and Truong Michelle
Home Financials for this Owner
Home Financials are based on the most recent Mortgage that was taken out on this home.
Original Mortgage
$192,000
Interest Rate
5.03%
Mortgage Type
New Conventional
Purchase Details
Closed on
Mar 3, 2010
Sold by
Figueroa Jose
Bought by
Inymac Inc
Create a Home Valuation Report for This Property
The Home Valuation Report is an in-depth analysis detailing your home's value as well as a comparison with similar homes in the area
Home Values in the Area
Average Home Value in this Area
Purchase History
| Date | Buyer | Sale Price | Title Company |
|---|---|---|---|
| Truong Tommy | -- | Fnas | |
| Dang Chau | -- | None Available | |
| Dang Chau | -- | Fidelity National Title Co | |
| Dang Chau | $352,000 | Ticor Title | |
| Inymac Inc | $210,000 | Accommodation | |
| Figueroa Jose | -- | Accommodation | |
| Figueroa Jose | -- | Accommodation |
Source: Public Records
Mortgage History
| Date | Status | Borrower | Loan Amount |
|---|---|---|---|
| Open | Dang Chau | $160,000 | |
| Closed | Dang Chau | $192,000 |
Source: Public Records
Tax History Compared to Growth
Tax History
| Year | Tax Paid | Tax Assessment Tax Assessment Total Assessment is a certain percentage of the fair market value that is determined by local assessors to be the total taxable value of land and additions on the property. | Land | Improvement |
|---|---|---|---|---|
| 2025 | $8,352 | $742,845 | $688,302 | $54,543 |
| 2024 | $8,352 | $728,280 | $674,806 | $53,474 |
| 2023 | $8,173 | $714,000 | $661,574 | $52,426 |
| 2022 | $8,120 | $700,000 | $648,601 | $51,399 |
| 2021 | $5,112 | $419,763 | $363,187 | $56,576 |
| 2020 | $5,054 | $415,459 | $359,463 | $55,996 |
| 2019 | $4,937 | $407,313 | $352,414 | $54,899 |
| 2018 | $4,854 | $399,327 | $345,504 | $53,823 |
| 2017 | $4,772 | $391,498 | $338,730 | $52,768 |
| 2016 | $4,687 | $383,822 | $332,088 | $51,734 |
| 2015 | $4,676 | $378,057 | $327,100 | $50,957 |
| 2014 | $4,425 | $370,652 | $320,693 | $49,959 |
Source: Public Records
Map
Nearby Homes
- 10301 Antigua St
- 10301 Rhiems Rd
- 1350 S Ashington Ln
- 1250 S Brookhurst St Unit 1059
- 1250 S Brookhurst St Unit 2028
- 1250 S Brookhurst St Unit 2080
- 1250 S Brookhurst St
- 1250 S Brookhurst St Unit 2033
- 1765 S Biscayne Ct
- 9272 Cerritos Ave
- 1737 S Garden Dr
- 1944 W Lullaby Ln
- 998 S Crossbow Ln Unit 12D
- 9592 Katella Ave
- 994 S Sutter Creek Rd Unit 60
- 958 S Crossbow Ln Unit 8
- 938 S Sutter Creek Rd Unit 54
- 917 S Sutter Creek Rd Unit 46
- 9155 Pacific Ave Unit 265
- 10112 Becca Dr
- 9812 Lullaby Ln
- 9792 Lullaby Ln
- 9801 Cerritos Ave
- 9811 Cerritos Ave
- 9791 Cerritos Ave
- 9772 Lullaby Ln
- 9832 Lullaby Ln
- 9801 Lullaby Ln
- 9791 Lullaby Ln
- 9811 Lullaby Ln
- 9771 Cerritos Ave
- 9831 Cerritos Ave
- 9771 Lullaby Ln
- 9842 Lullaby Ln
- 9831 Lullaby Ln
- 9841 Cerritos Ave
- 9802 Harriet Ln
- 9792 Harriet Ln
- 9812 Harriet Ln
- 9852 Lullaby Ln