9803 E 119th St S Bixby, OK 74008
North Bixby NeighborhoodEstimated Value: $279,410 - $313,000
3
Beds
2
Baths
1,813
Sq Ft
$163/Sq Ft
Est. Value
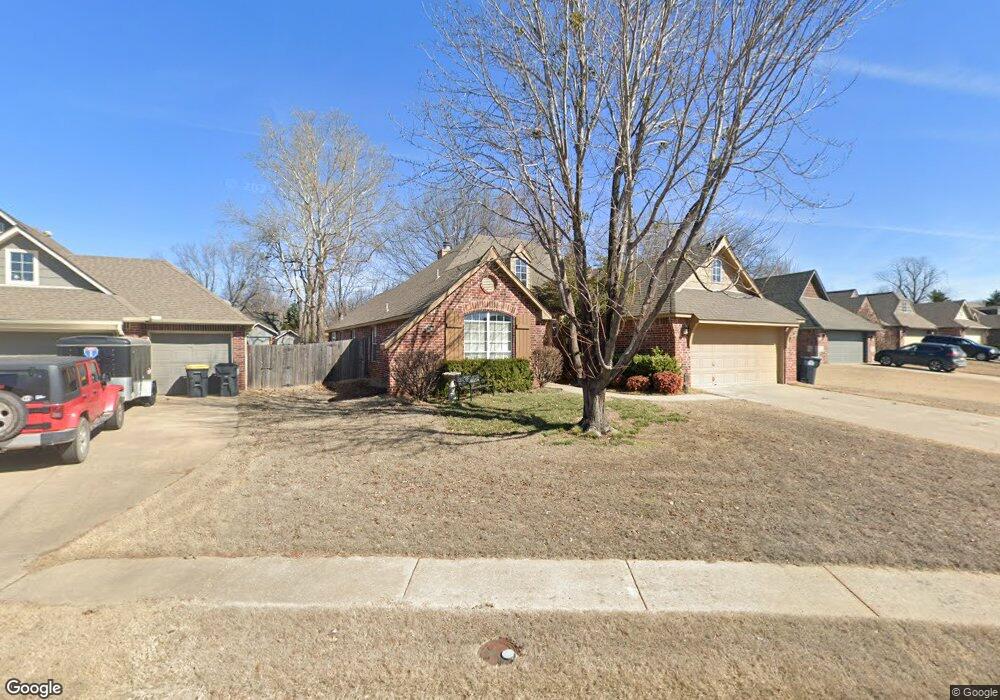
About This Home
This home is located at 9803 E 119th St S, Bixby, OK 74008 and is currently estimated at $296,103, approximately $163 per square foot. 9803 E 119th St S is a home located in Tulsa County with nearby schools including Bixby East Elementary, Bixby Middle School, and Bixby High School.
Ownership History
Date
Name
Owned For
Owner Type
Purchase Details
Closed on
Jul 7, 2024
Sold by
Subramaniam Prakasa
Bought by
9803 Bixby Llc
Current Estimated Value
Purchase Details
Closed on
May 27, 2017
Sold by
Kunaseelan Sheela D and Subramaniam Sheela Dewi
Bought by
Subramaniam Prakasa
Purchase Details
Closed on
Jan 16, 2013
Sold by
Subramaniam Sheela D
Bought by
Subramaniam Prakasa
Purchase Details
Closed on
Feb 22, 2005
Sold by
Cendant Mobility Services Corp
Bought by
Subramaniam Prakasa and Subramaniam Shella Dewi
Home Financials for this Owner
Home Financials are based on the most recent Mortgage that was taken out on this home.
Original Mortgage
$116,000
Interest Rate
4.87%
Mortgage Type
Purchase Money Mortgage
Purchase Details
Closed on
Jan 12, 2004
Sold by
Ping John R
Bought by
Cendant Mobility Services Corp
Purchase Details
Closed on
Feb 25, 2002
Sold by
R Cooke Homes Inc
Bought by
Ping John R
Create a Home Valuation Report for This Property
The Home Valuation Report is an in-depth analysis detailing your home's value as well as a comparison with similar homes in the area
Home Values in the Area
Average Home Value in this Area
Purchase History
| Date | Buyer | Sale Price | Title Company |
|---|---|---|---|
| 9803 Bixby Llc | -- | None Listed On Document | |
| Subramaniam Prakasa | -- | None Available | |
| Subramaniam Prakasa | -- | None Available | |
| Subramaniam Prakasa | $145,000 | Oklahoma Title & Closing Co | |
| Cendant Mobility Services Corp | $145,000 | Oklahoma Title & Closing Co | |
| Ping John R | $147,000 | -- |
Source: Public Records
Mortgage History
| Date | Status | Borrower | Loan Amount |
|---|---|---|---|
| Previous Owner | Subramaniam Prakasa | $116,000 | |
| Closed | Subramaniam Prakasa | $29,000 |
Source: Public Records
Tax History
| Year | Tax Paid | Tax Assessment Tax Assessment Total Assessment is a certain percentage of the fair market value that is determined by local assessors to be the total taxable value of land and additions on the property. | Land | Improvement |
|---|---|---|---|---|
| 2025 | $4,232 | $30,855 | $4,256 | $26,599 |
| 2024 | $2,604 | $19,205 | $2,752 | $16,453 |
| 2023 | $2,604 | $19,616 | $3,035 | $16,581 |
| 2022 | $2,535 | $18,045 | $3,387 | $14,658 |
| 2021 | $2,297 | $17,491 | $3,283 | $14,208 |
| 2020 | $2,240 | $16,952 | $3,594 | $13,358 |
| 2019 | $2,179 | $16,429 | $3,483 | $12,946 |
| 2018 | $2,092 | $15,921 | $3,375 | $12,546 |
| 2017 | $2,015 | $16,429 | $3,483 | $12,946 |
| 2016 | $1,929 | $15,950 | $4,092 | $11,858 |
| 2015 | $1,845 | $15,950 | $4,092 | $11,858 |
| 2014 | $1,842 | $15,950 | $4,092 | $11,858 |
Source: Public Records
Map
Nearby Homes
- 9632 E 118th Place S
- 9613 E 119th Ct S
- 11973 S 96th East Place
- 11713 S 96th East Place
- 11965 S 94th East Ave
- 13154 S 100th East Ave
- 11962 S 94th East Ave
- 9528 E 117th St S
- 6031 E 119th Place S
- 11966 S 94th East Ave
- 9705 E 116th Place S
- 9745 E 116th Place S
- 9919 E 123rd St S
- 13512 S 101st East Ave
- 10209 E 121st Place S
- 9925 E 124th St S
- 12313 S 98th East Ave
- 11946 S 90th East Ave
- 10297 E 121st Place S
- 10309 E 115th Place S
- 9807 E 119th St S
- 9727 E 119th St S
- 9819 E 119th St S
- 9715 E 119th St S
- 9812 E 118th St S
- 9704 E 118th St S
- 11918 S 98th East Ave
- 9816 E 118th St S
- 9831 E 119th St S
- 11921 S 98th East Ave
- 9702 E 118th St S
- 9820 E 119th St S
- 9806 E 118th St S
- 11924 S 98th East Ave
- 9843 E 119th St S
- 11927 S 98th East Ave
- 9832 E 119th St S
- 11930 S 98th East Ave
- 9902 E 118th St S
- 9801 E 118th St S
Your Personal Tour Guide
Ask me questions while you tour the home.