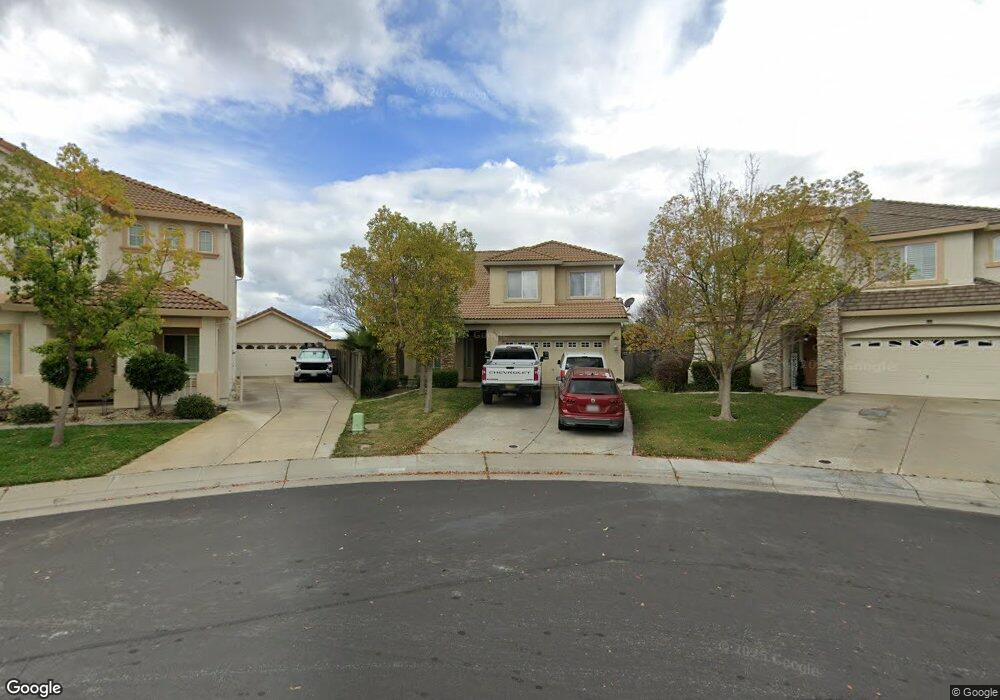
9804 Ruddy Duck Way Elk Grove, CA 95757
North West Elk Grove NeighborhoodEstimated Value: $516,000 - $664,000
4
Beds
3
Baths
2,228
Sq Ft
$278/Sq Ft
Est. Value
About This Home
This home is located at 9804 Ruddy Duck Way, Elk Grove, CA 95757 and is currently estimated at $620,052, approximately $278 per square foot. 9804 Ruddy Duck Way is a home located in Sacramento County with nearby schools including Elliott Ranch Elementary School, Elizabeth Pinkerton Middle School, and Cosumnes Oaks High School.
Ownership History
Date
Name
Owned For
Owner Type
Purchase Details
Closed on
Sep 18, 2012
Sold by
Marrelli Brenton C and Calderon Rosario S
Bought by
Thr California
Current Estimated Value
Purchase Details
Closed on
Jul 14, 2006
Sold by
Smoot Jiaranai
Bought by
Marrelli Brenton C and Calderon Rosario S
Home Financials for this Owner
Home Financials are based on the most recent Mortgage that was taken out on this home.
Original Mortgage
$416,000
Interest Rate
7.37%
Mortgage Type
Purchase Money Mortgage
Purchase Details
Closed on
Jul 1, 2003
Sold by
John Mourier Construction Inc
Bought by
Smoot Jiaranai
Home Financials for this Owner
Home Financials are based on the most recent Mortgage that was taken out on this home.
Original Mortgage
$276,400
Interest Rate
5.13%
Mortgage Type
Purchase Money Mortgage
Create a Home Valuation Report for This Property
The Home Valuation Report is an in-depth analysis detailing your home's value as well as a comparison with similar homes in the area
Home Values in the Area
Average Home Value in this Area
Purchase History
| Date | Buyer | Sale Price | Title Company |
|---|---|---|---|
| Thr California | $237,000 | None Available | |
| Marrelli Brenton C | $520,000 | Alliance Title Company | |
| Smoot Jiaranai | $290,000 | Old Republic Title Company |
Source: Public Records
Mortgage History
| Date | Status | Borrower | Loan Amount |
|---|---|---|---|
| Previous Owner | Marrelli Brenton C | $416,000 | |
| Previous Owner | Smoot Jiaranai | $276,400 |
Source: Public Records
Tax History Compared to Growth
Tax History
| Year | Tax Paid | Tax Assessment Tax Assessment Total Assessment is a certain percentage of the fair market value that is determined by local assessors to be the total taxable value of land and additions on the property. | Land | Improvement |
|---|---|---|---|---|
| 2025 | $5,465 | $475,835 | $145,071 | $330,764 |
| 2024 | $5,465 | $466,506 | $142,227 | $324,279 |
| 2023 | $5,462 | $457,360 | $139,439 | $317,921 |
| 2022 | $5,390 | $448,393 | $136,705 | $311,688 |
| 2021 | $5,327 | $439,602 | $134,025 | $305,577 |
| 2020 | $5,268 | $435,095 | $132,651 | $302,444 |
| 2019 | $5,175 | $426,564 | $130,050 | $296,514 |
| 2018 | $3,919 | $285,711 | $91,989 | $193,722 |
| 2017 | $3,849 | $280,110 | $90,186 | $189,924 |
| 2016 | $3,693 | $274,618 | $88,418 | $186,200 |
| 2015 | $3,628 | $270,494 | $87,090 | $183,404 |
| 2014 | $3,583 | $265,197 | $85,385 | $179,812 |
Source: Public Records
Map
Nearby Homes
- 2432 Rock Dove Way
- 9504 Coney Island Cir Unit 1
- 2624 W Pintail Way
- 9541 Coney Island Cir Unit 125
- 9653 Sea Cliff Way
- 9608 Crystal Bay Ln
- 3430 Sierra Meadow Ct
- 0 9th St Unit 225145877
- 3619 Lake Terrace Dr
- 3516 Grimshaw Way
- 3909 Packwood Way
- 9529 Madrid Way
- 9910 Del Surf Ln
- 4218 Ocean Ln
- 9313 Edisto Way
- 10000 Asilomar Ln
- 9521 River Rd
- 10065 Waterfield Dr
- 9820 Spring View Way
- 5109 Ocean Ln
- 9808 Ruddy Duck Way
- 9800 Ruddy Duck Way
- 9812 Ruddy Duck Way
- 9798 Ruddy Duck Way
- 9816 Ruddy Duck Way
- 9794 Ruddy Duck Way
- 9809 Ruddy Duck Way
- 9790 Ruddy Duck Way
- 9820 Ruddy Duck Way
- 9817 Ruddy Duck Way
- 9786 Ruddy Duck Way
- 9824 Ruddy Duck Way
- 9825 Ruddy Duck Way
- 9744 W Taron Dr
- 9782 Ruddy Duck Way
- 9828 Ruddy Duck Way
- 9748 W Taron Dr
- 9829 Ruddy Duck Way
- 9752 W Taron Dr
- 9832 Ruddy Duck Way