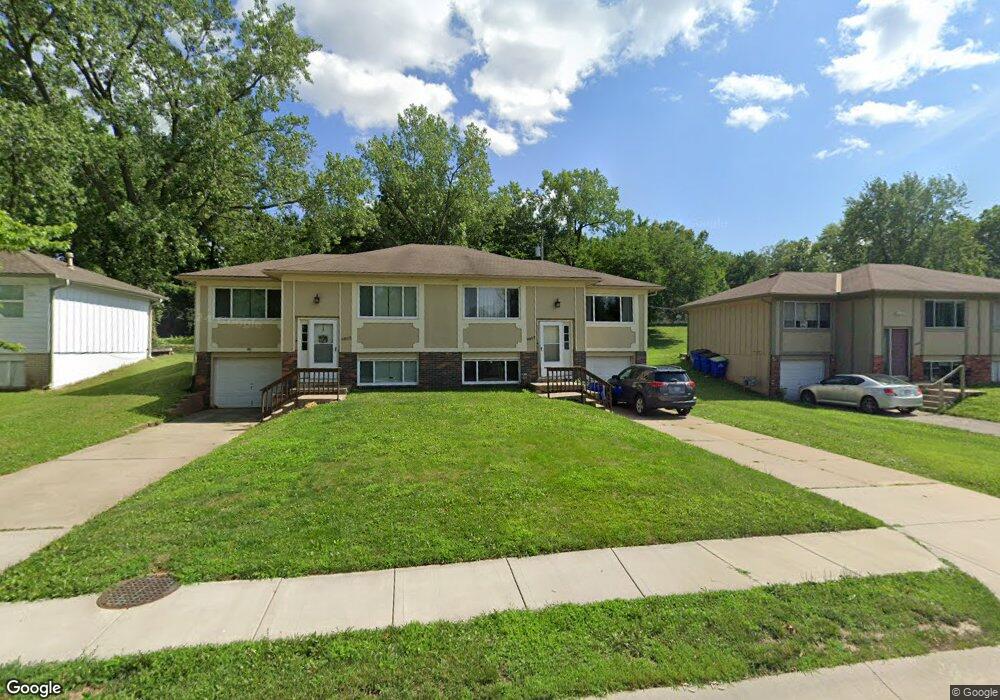
9807 W 52nd St Shawnee, KS 66203
Estimated Value: $210,000 - $226,282
3
Beds
2
Baths
960
Sq Ft
$227/Sq Ft
Est. Value
About This Home
This home is located at 9807 W 52nd St, Shawnee, KS 66203 and is currently estimated at $217,571, approximately $226 per square foot. 9807 W 52nd St is a home located in Johnson County with nearby schools including Merriam Park Elementary School, Hocker Grove Middle School, and Shawnee Mission North High School.
Ownership History
Date
Name
Owned For
Owner Type
Purchase Details
Closed on
May 26, 2023
Sold by
Fry Michael H and Fry Lindsay M
Bought by
Fry Michael H and Fry Lindsay M
Current Estimated Value
Purchase Details
Closed on
Dec 10, 2015
Sold by
Mohammed Abdul S and Azaz Farha
Bought by
Ffonsas Llc
Purchase Details
Closed on
May 12, 2006
Sold by
Kalny Benjamin C and Kalny Valerie E
Bought by
Fry Michael H and Fry Lindsay M
Home Financials for this Owner
Home Financials are based on the most recent Mortgage that was taken out on this home.
Original Mortgage
$75,000
Interest Rate
6.5%
Mortgage Type
New Conventional
Purchase Details
Closed on
Feb 19, 2006
Sold by
Kalny Benjamin C and Kalny Valerie E
Bought by
Kalny Benjamin C and Kalny Valerie E
Create a Home Valuation Report for This Property
The Home Valuation Report is an in-depth analysis detailing your home's value as well as a comparison with similar homes in the area
Home Values in the Area
Average Home Value in this Area
Purchase History
| Date | Buyer | Sale Price | Title Company |
|---|---|---|---|
| Fry Michael H | -- | None Listed On Document | |
| Ffonsas Llc | -- | -- | |
| Fry Michael H | -- | Mid America Title Company | |
| Kalny Benjamin C | -- | Mid American Title Co |
Source: Public Records
Mortgage History
| Date | Status | Borrower | Loan Amount |
|---|---|---|---|
| Previous Owner | Fry Michael H | $75,000 |
Source: Public Records
Tax History Compared to Growth
Tax History
| Year | Tax Paid | Tax Assessment Tax Assessment Total Assessment is a certain percentage of the fair market value that is determined by local assessors to be the total taxable value of land and additions on the property. | Land | Improvement |
|---|---|---|---|---|
| 2024 | $2,127 | $20,574 | $2,811 | $17,763 |
| 2023 | $2,015 | $19,596 | $2,811 | $16,785 |
| 2022 | $1,798 | $16,905 | $2,552 | $14,353 |
| 2021 | $1,575 | $14,030 | $2,318 | $11,712 |
| 2020 | $1,495 | $13,236 | $2,018 | $11,218 |
| 2019 | $1,531 | $13,536 | $1,754 | $11,782 |
| 2018 | $1,364 | $12,040 | $1,596 | $10,444 |
| 2017 | $1,221 | $10,672 | $1,596 | $9,076 |
| 2016 | $1,174 | $10,154 | $1,596 | $8,558 |
| 2015 | $1,086 | $9,487 | $1,596 | $7,891 |
| 2013 | -- | $9,372 | $1,596 | $7,776 |
Source: Public Records
Map
Nearby Homes
- 9719 W 53rd St
- 9929 W 52nd St
- 5220 Hayes St
- 10116 W 52nd Terrace
- 5003 Knox Ave
- 9328 W 51st St
- 5517 Hayes St
- 0 W 49th St
- 10511 W 49th Place
- 9201 W 48th Terrace
- The Fleetwood Plan at Bristol Highlands - The Villas
- The Fleetwood Plan at Bristol Highlands - The Manors
- The Kirkwood Plan at Bristol Highlands - The Villas
- 8013 Payne St
- The Rockwood Plan at Bristol Highlands - The Villas
- 9012 W 49th St
- 8613 W 54th Terrace
- 5405 Oliver St
- 11002 W 55th Terrace
- 4807 Oliver Ct