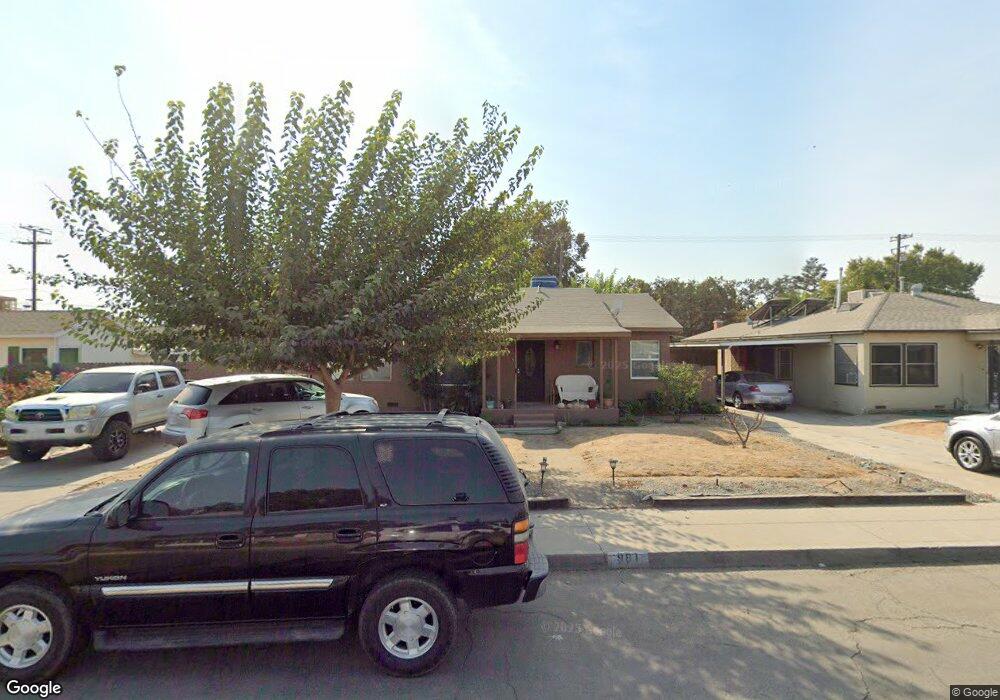
981 E Apricot Ave Tulare, CA 93274
Northeast Tulare NeighborhoodEstimated Value: $215,372 - $275,000
3
Beds
1
Bath
1,016
Sq Ft
$234/Sq Ft
Est. Value
About This Home
This home is located at 981 E Apricot Ave, Tulare, CA 93274 and is currently estimated at $237,843, approximately $234 per square foot. 981 E Apricot Ave is a home located in Tulare County with nearby schools including Wilson Elementary School, Cherry Avenue Middle School, and Tulare Union High School.
Ownership History
Date
Name
Owned For
Owner Type
Purchase Details
Closed on
Sep 13, 2011
Sold by
Martinez David A
Bought by
Espinola Felix A and Espinola Octaviana
Current Estimated Value
Purchase Details
Closed on
Mar 6, 2006
Sold by
Martinez David A
Bought by
Martinez David A
Purchase Details
Closed on
May 11, 2004
Sold by
Landin Raymond
Bought by
Martinez David
Home Financials for this Owner
Home Financials are based on the most recent Mortgage that was taken out on this home.
Original Mortgage
$104,000
Interest Rate
4.5%
Mortgage Type
Purchase Money Mortgage
Purchase Details
Closed on
Dec 18, 2001
Sold by
Gray Dennis L
Bought by
Landin Raymond
Home Financials for this Owner
Home Financials are based on the most recent Mortgage that was taken out on this home.
Original Mortgage
$87,624
Interest Rate
7.15%
Mortgage Type
FHA
Create a Home Valuation Report for This Property
The Home Valuation Report is an in-depth analysis detailing your home's value as well as a comparison with similar homes in the area
Home Values in the Area
Average Home Value in this Area
Purchase History
| Date | Buyer | Sale Price | Title Company |
|---|---|---|---|
| Espinola Felix A | $60,000 | Chicago Title Company | |
| Martinez David A | -- | Financial Title Company | |
| Martinez David | $130,000 | Chicago Title Co | |
| Landin Raymond | $89,000 | Fidelity National Title Co |
Source: Public Records
Mortgage History
| Date | Status | Borrower | Loan Amount |
|---|---|---|---|
| Previous Owner | Martinez David | $104,000 | |
| Previous Owner | Landin Raymond | $87,624 | |
| Closed | Martinez David | $26,000 |
Source: Public Records
Tax History
| Year | Tax Paid | Tax Assessment Tax Assessment Total Assessment is a certain percentage of the fair market value that is determined by local assessors to be the total taxable value of land and additions on the property. | Land | Improvement |
|---|---|---|---|---|
| 2025 | $820 | $75,361 | $31,399 | $43,962 |
| 2024 | $820 | $73,884 | $30,784 | $43,100 |
| 2023 | $799 | $72,436 | $30,181 | $42,255 |
| 2022 | $776 | $71,017 | $29,590 | $41,427 |
| 2021 | $766 | $69,625 | $29,010 | $40,615 |
| 2020 | $779 | $68,912 | $28,713 | $40,199 |
| 2019 | $799 | $67,561 | $28,150 | $39,411 |
| 2018 | $786 | $66,236 | $27,598 | $38,638 |
| 2017 | $778 | $64,937 | $27,057 | $37,880 |
| 2016 | $744 | $63,663 | $26,526 | $37,137 |
| 2015 | $719 | $62,707 | $26,128 | $36,579 |
| 2014 | $719 | $61,478 | $25,616 | $35,862 |
Source: Public Records
Map
Nearby Homes
- 861 E Sycamore Ave
- 815 E Sycamore Ave
- 320 N Blackstone St Unit 14
- 149 S Salida Place
- 855 E Pleasant Ave
- 648 Auburn St
- 620 Mariposa Ave
- 563 N O St
- 1 Spruce St
- 202 N L St
- 1611 E Burton Ave
- 456 S Becky St
- 2012 Diamante Dr
- 0 Spruce St S Unit 239148
- 0 Spruce St S Unit 233400
- 421 S Laspina St
- 501 S Magnolia St
- 0 0 Unit CV26015491
- 1453 E Sonora Ave
- 1741 Vineland Ave
- 341 N Highland St
- 979 E Apricot Ave
- 965 E Apricot Ave
- 990 E San Joaquin Ave
- 984 E Apricot Ave
- 976 E San Joaquin Ave
- 953 E Apricot Ave
- 996 E San Joaquin Ave
- 970 E San Joaquin Ave
- 968 E Apricot Ave
- 409 N Highland St
- 308 N Highland St
- 340 N Highland St
- 390 N Highland St
- 960 E Apricot Ave
- 948 E San Joaquin Ave
- 320 N Highland St
- 949 E Apricot Ave
- 360 N Highland St
- 1008 E San Joaquin Ave
Your Personal Tour Guide
Ask me questions while you tour the home.