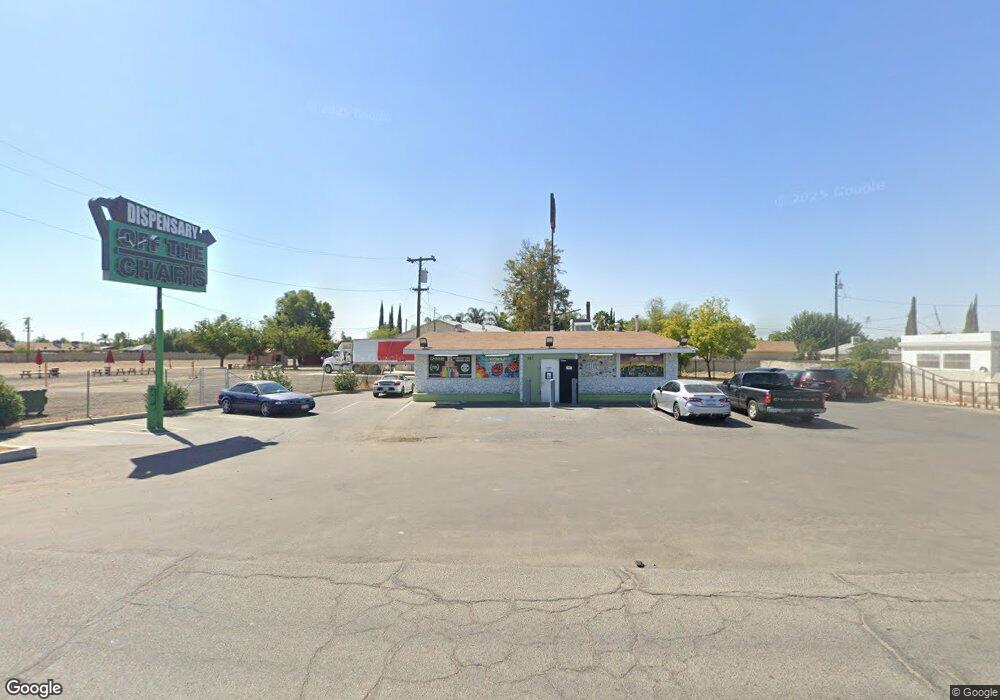
981 Frontage Rd McFarland, CA 93250
Estimated Value: $334,000 - $374,000
Studio
--
Bath
1,506
Sq Ft
$232/Sq Ft
Est. Value
About This Home
This home is located at 981 Frontage Rd, McFarland, CA 93250 and is currently estimated at $349,304, approximately $231 per square foot. 981 Frontage Rd is a home located in Kern County with nearby schools including McFarland High School.
Ownership History
Date
Name
Owned For
Owner Type
Purchase Details
Closed on
Aug 18, 2013
Sold by
Garcia Elias and Garcia Micaela
Bought by
Diaz Guadalupe Fernanda Garcia
Current Estimated Value
Purchase Details
Closed on
Apr 19, 2013
Sold by
Fajardo Paniagua Maria Eugenia and Fajardo Maria
Bought by
Garcia Elias
Home Financials for this Owner
Home Financials are based on the most recent Mortgage that was taken out on this home.
Original Mortgage
$120,261
Outstanding Balance
$85,042
Interest Rate
3.51%
Mortgage Type
Commercial
Estimated Equity
$264,263
Purchase Details
Closed on
Dec 21, 2005
Sold by
Fajardo Juan A
Bought by
Fajardo Maria
Home Financials for this Owner
Home Financials are based on the most recent Mortgage that was taken out on this home.
Original Mortgage
$165,000
Interest Rate
6.36%
Mortgage Type
Seller Take Back
Purchase Details
Closed on
Feb 7, 1995
Sold by
Frausto Antonio T and Frausto Virginia R
Bought by
Frausto Antonio T
Create a Home Valuation Report for This Property
The Home Valuation Report is an in-depth analysis detailing your home's value as well as a comparison with similar homes in the area
Home Values in the Area
Average Home Value in this Area
Purchase History
| Date | Buyer | Sale Price | Title Company |
|---|---|---|---|
| Diaz Guadalupe Fernanda Garcia | -- | None Available | |
| Garcia Elias | $175,000 | Accommodation | |
| Fajardo Maria | -- | Alliance Title | |
| Fajardo Maria | $185,000 | Alliance Title | |
| Frausto Antonio T | -- | -- |
Source: Public Records
Mortgage History
| Date | Status | Borrower | Loan Amount |
|---|---|---|---|
| Open | Garcia Elias | $120,261 | |
| Previous Owner | Fajardo Maria | $165,000 |
Source: Public Records
Tax History
| Year | Tax Paid | Tax Assessment Tax Assessment Total Assessment is a certain percentage of the fair market value that is determined by local assessors to be the total taxable value of land and additions on the property. | Land | Improvement |
|---|---|---|---|---|
| 2025 | $2,456 | $295,487 | $67,722 | $227,765 |
| 2024 | $2,426 | $211,263 | $66,395 | $144,868 |
| 2023 | $2,426 | $207,122 | $65,094 | $142,028 |
| 2022 | $2,377 | $203,062 | $63,818 | $139,244 |
| 2021 | $2,350 | $199,081 | $62,567 | $136,514 |
| 2020 | $2,303 | $197,041 | $61,926 | $135,115 |
| 2019 | $2,165 | $197,041 | $61,926 | $135,115 |
| 2018 | $2,137 | $189,391 | $59,522 | $129,869 |
| 2017 | $2,080 | $185,678 | $58,355 | $127,323 |
| 2016 | $2,051 | $182,038 | $57,211 | $124,827 |
| 2015 | $2,012 | $179,304 | $56,352 | $122,952 |
| 2014 | $1,922 | $175,793 | $55,249 | $120,544 |
Source: Public Records
Map
Nearby Homes
- 830 Davis Ave
- 749 Browning Rd
- 704 Cabo San Lucas Ct
- 249 Robertson Ave
- 733 Ensenata Dr
- 0 Costa Alyssa Dr Unit 202602697
- 0 W Sherwood Ave Unit 202506495
- 0 W Sherwood Ave Unit 21453658
- 276 San Juan St
- 314 8th St
- 216 Browning Rd
- 124 4th Place
- 148 San Lucas St
- 254 E Sherwood Ave
- 0 E Sherwood Ave
- 737 Misty Ave
- 714 Hayden Ave
- 737 Concord Ct
- 13271 Garzoli Ave
- 805 Price St
Your Personal Tour Guide
Ask me questions while you tour the home.