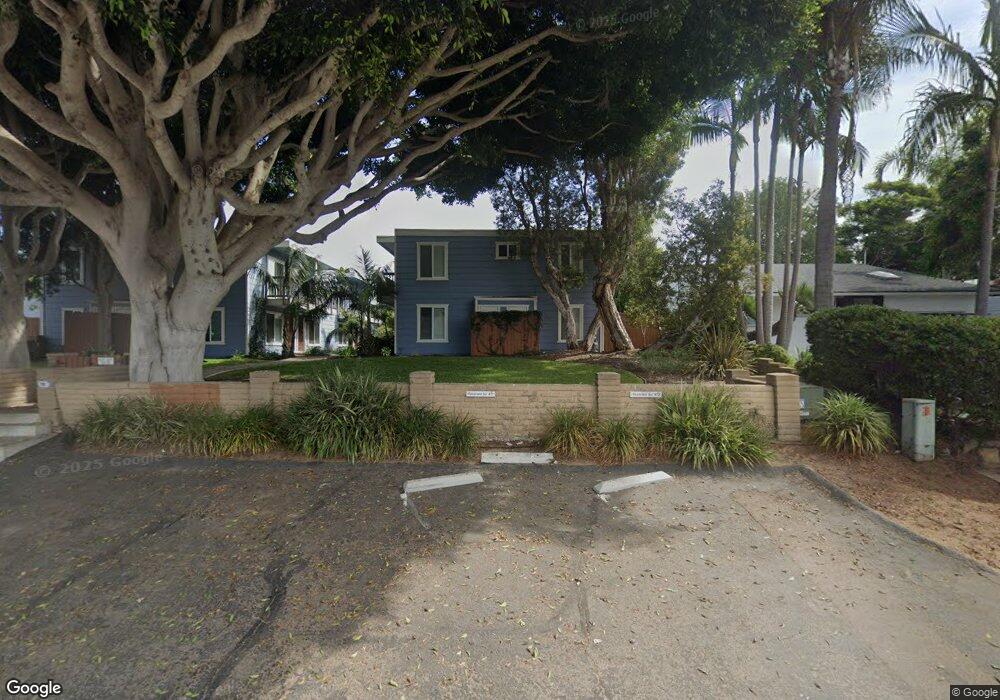
981 N Vulcan Ave Unit 10 Encinitas, CA 92024
Estimated Value: $967,000 - $1,066,000
2
Beds
2
Baths
960
Sq Ft
$1,044/Sq Ft
Est. Value
About This Home
This home is located at 981 N Vulcan Ave Unit 10, Encinitas, CA 92024 and is currently estimated at $1,002,257, approximately $1,044 per square foot. 981 N Vulcan Ave Unit 10 is a home located in San Diego County with nearby schools including Paul Ecke-Central Elementary, Diegueno Middle School, and La Costa Canyon High School.
Ownership History
Date
Name
Owned For
Owner Type
Purchase Details
Closed on
Apr 10, 2008
Sold by
Cook Monica M
Bought by
Cook Joshua T
Current Estimated Value
Home Financials for this Owner
Home Financials are based on the most recent Mortgage that was taken out on this home.
Original Mortgage
$40,000
Outstanding Balance
$8,205
Interest Rate
5.99%
Mortgage Type
Stand Alone Second
Estimated Equity
$994,052
Purchase Details
Closed on
Dec 11, 2001
Sold by
Vanwell Shirley J
Bought by
Cook Joshua T and Cook Monica M
Home Financials for this Owner
Home Financials are based on the most recent Mortgage that was taken out on this home.
Original Mortgage
$200,000
Interest Rate
6.84%
Purchase Details
Closed on
Jul 24, 1990
Purchase Details
Closed on
Jun 18, 1986
Create a Home Valuation Report for This Property
The Home Valuation Report is an in-depth analysis detailing your home's value as well as a comparison with similar homes in the area
Home Values in the Area
Average Home Value in this Area
Purchase History
| Date | Buyer | Sale Price | Title Company |
|---|---|---|---|
| Cook Joshua T | -- | None Available | |
| Cook Joshua T | $250,000 | Fidelity National Title Co | |
| -- | $127,100 | -- | |
| -- | $79,000 | -- |
Source: Public Records
Mortgage History
| Date | Status | Borrower | Loan Amount |
|---|---|---|---|
| Open | Cook Joshua T | $40,000 | |
| Open | Cook Joshua T | $320,000 | |
| Closed | Cook Joshua T | $200,000 |
Source: Public Records
Tax History Compared to Growth
Tax History
| Year | Tax Paid | Tax Assessment Tax Assessment Total Assessment is a certain percentage of the fair market value that is determined by local assessors to be the total taxable value of land and additions on the property. | Land | Improvement |
|---|---|---|---|---|
| 2025 | $4,429 | $369,304 | $221,584 | $147,720 |
| 2024 | $4,429 | $362,064 | $217,240 | $144,824 |
| 2023 | $4,280 | $354,966 | $212,981 | $141,985 |
| 2022 | $4,162 | $348,006 | $208,805 | $139,201 |
| 2021 | $4,077 | $341,183 | $204,711 | $136,472 |
| 2020 | $3,996 | $337,685 | $202,612 | $135,073 |
| 2019 | $3,921 | $331,065 | $198,640 | $132,425 |
| 2018 | $3,850 | $324,575 | $194,746 | $129,829 |
| 2017 | $191 | $318,212 | $190,928 | $127,284 |
| 2016 | $3,676 | $311,974 | $187,185 | $124,789 |
| 2015 | $3,598 | $307,289 | $184,374 | $122,915 |
| 2014 | $3,506 | $301,271 | $180,763 | $120,508 |
Source: Public Records
Map
Nearby Homes
- 123 Jasper St Unit 12
- 159 Diana St Unit 6
- 149 W Glaucus St Unit D
- 170 Diana St Unit 24
- 170 Diana St Unit 29
- 170 Diana St Unit 20
- 806 Hygeia Ave
- 699 N Vulcan Ave Unit 133
- 699 N Vulcan Ave Unit 134
- 699 N Vulcan Ave Unit 17
- 699 N Vulcan Ave Unit SPC 135
- 699 N Vulcan Ave Unit SPC 113
- 699 N Vulcan Ave Unit 80
- 155 W Jason St Unit 6
- 870 Hymettus Ave
- 1230 Neptune Ave
- 674 Calypso Place
- 0 Fulvia St Unit NDP2505418
- 557 N Vulcan Ave
- 553 Hygeia Ave Unit A
- 981 N Vulcan Ave
- 981 N Vulcan Ave Unit 12
- 981 N Vulcan Ave Unit 11
- 981 N Vulcan Ave Unit 9
- 981 N Vulcan Ave Unit 8
- 981 N Vulcan Ave Unit 7
- 981 N Vulcan Ave Unit 6
- 981 N Vulcan Ave Unit 5
- 981 N Vulcan Ave Unit 4
- 981 N Vulcan Ave Unit 3
- 981 N Vulcan Ave Unit 2
- 981 N Vulcan Ave Unit 1
- 993 N Vulcan Ave
- 979 N Vulcan Ave
- 957 N Vulcan Ave
- 986 Hermes Ave
- 959 N Vulcan Ave Unit 61
- 1005 N Vulcan Ave
- N Vulcan Unit 67
- N Vulcan Unit 69