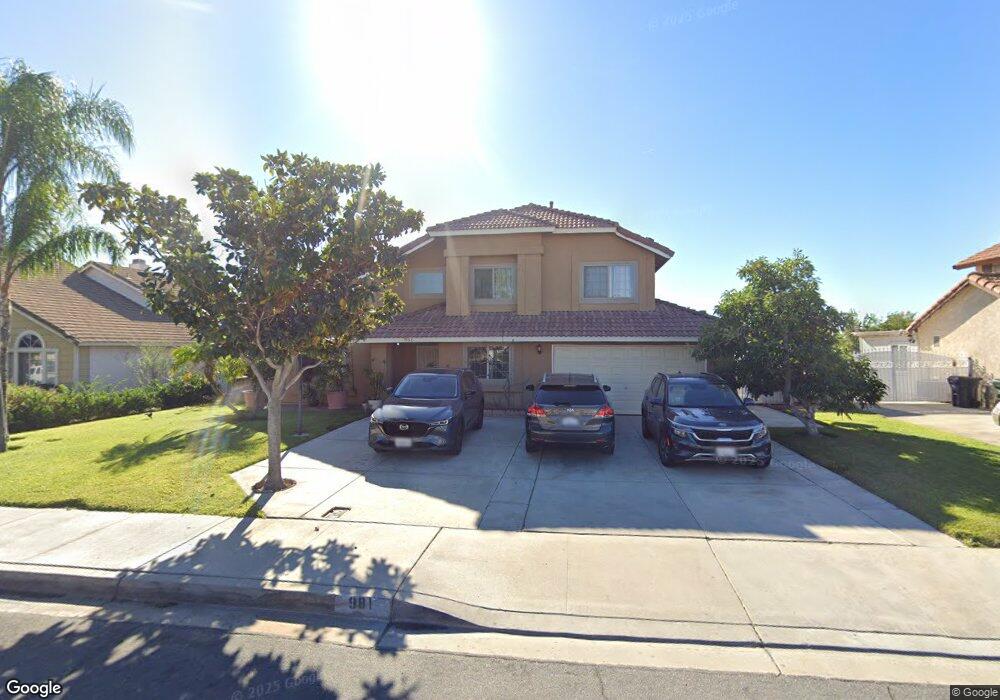
981 W Huff St Rialto, CA 92376
Estimated Value: $614,321 - $683,000
4
Beds
3
Baths
1,768
Sq Ft
$363/Sq Ft
Est. Value
About This Home
This home is located at 981 W Huff St, Rialto, CA 92376 and is currently estimated at $641,080, approximately $362 per square foot. 981 W Huff St is a home located in San Bernardino County with nearby schools including Sam V. Curtis Elementary School, Rialto Middle School, and Rialto High School.
Ownership History
Date
Name
Owned For
Owner Type
Purchase Details
Closed on
Jan 15, 2019
Sold by
Diaz Celia
Bought by
Diaz Celia and The Celia Diaz Revocable Trust
Current Estimated Value
Purchase Details
Closed on
Feb 6, 2017
Sold by
Ramirez Celina Diaz
Bought by
Diaz Celia
Purchase Details
Closed on
Feb 7, 2014
Sold by
Diaz Celia
Bought by
Diaz Celia and Ramirez Celina Diaz
Purchase Details
Closed on
Mar 27, 2008
Sold by
Diaz Antonio and Diaz Celia
Bought by
Diaz Antonio and Diaz Celia
Purchase Details
Closed on
Apr 2, 2000
Sold by
Diaz Antonio
Bought by
Diaz Antonio and Diaz Celia
Purchase Details
Closed on
Sep 8, 1994
Sold by
Bejarano Benjamin and Bejarano Cheryl
Bought by
Diaz Antonio and Diaz Celia
Home Financials for this Owner
Home Financials are based on the most recent Mortgage that was taken out on this home.
Original Mortgage
$92,000
Interest Rate
9.75%
Create a Home Valuation Report for This Property
The Home Valuation Report is an in-depth analysis detailing your home's value as well as a comparison with similar homes in the area
Home Values in the Area
Average Home Value in this Area
Purchase History
| Date | Buyer | Sale Price | Title Company |
|---|---|---|---|
| Diaz Celia | -- | None Available | |
| Diaz Celia | -- | None Available | |
| Diaz Celia | -- | None Available | |
| Diaz Antonio | -- | None Available | |
| Diaz Antonio | -- | -- | |
| Diaz Antonio | $142,000 | First American Title Ins Co |
Source: Public Records
Mortgage History
| Date | Status | Borrower | Loan Amount |
|---|---|---|---|
| Previous Owner | Diaz Antonio | $92,000 |
Source: Public Records
Tax History
| Year | Tax Paid | Tax Assessment Tax Assessment Total Assessment is a certain percentage of the fair market value that is determined by local assessors to be the total taxable value of land and additions on the property. | Land | Improvement |
|---|---|---|---|---|
| 2025 | $3,943 | $238,519 | $41,997 | $196,522 |
| 2024 | $3,249 | $233,843 | $41,174 | $192,669 |
| 2023 | $3,433 | $229,258 | $40,367 | $188,891 |
| 2022 | $3,181 | $224,762 | $39,575 | $185,187 |
| 2021 | $3,162 | $220,355 | $38,799 | $181,556 |
| 2020 | $3,169 | $218,095 | $38,401 | $179,694 |
| 2019 | $3,104 | $213,819 | $37,648 | $176,171 |
| 2018 | $3,108 | $209,627 | $36,910 | $172,717 |
| 2017 | $3,563 | $205,516 | $36,186 | $169,330 |
| 2016 | $3,043 | $201,486 | $35,476 | $166,010 |
| 2015 | $2,621 | $198,459 | $34,943 | $163,516 |
| 2014 | $2,467 | $194,572 | $34,259 | $160,313 |
Source: Public Records
Map
Nearby Homes
- 618 S Brampton Ave
- 675 S Mandarin Ln
- 646 S Fillmore Ave
- 504 S Quince Ave
- 506 S Althea Ave
- 697 S Smoketree Ave
- 839 S Aspen Ave
- 1510 W Merrill Ave
- 18316 W Hawthorne St
- 520 W Randall Ave
- 405 W Merrill Ave
- 514 W Randall Ave
- 9416 Cedar Ave
- 616 S Millard Ave
- 1156 W 2nd St
- 350 S Willow Ave Unit 115
- 350 S Willow Ave Unit 106
- 350 S Willow Ave Unit 74
- 350 S Willow Ave Unit 63
- 778 Bloomington Ave
- 971 W Huff St
- 991 W Huff St
- 978 W Carter St
- 997 W Carter St
- 961 W Huff St
- 982 W Huff St
- 552 S Beechwood Ave
- 972 W Huff St
- 1005 W Huff St
- 992 W Huff St
- 987 W Carter St
- 551 S Brierwood Ave
- 962 W Huff St
- 948 W Carter St
- 1006 W Huff St
- 938 W Carter St
- 565 S Brierwood Ave
- 952 W Huff St
- 977 W Carter St
- 1018 W Huff St
Your Personal Tour Guide
Ask me questions while you tour the home.