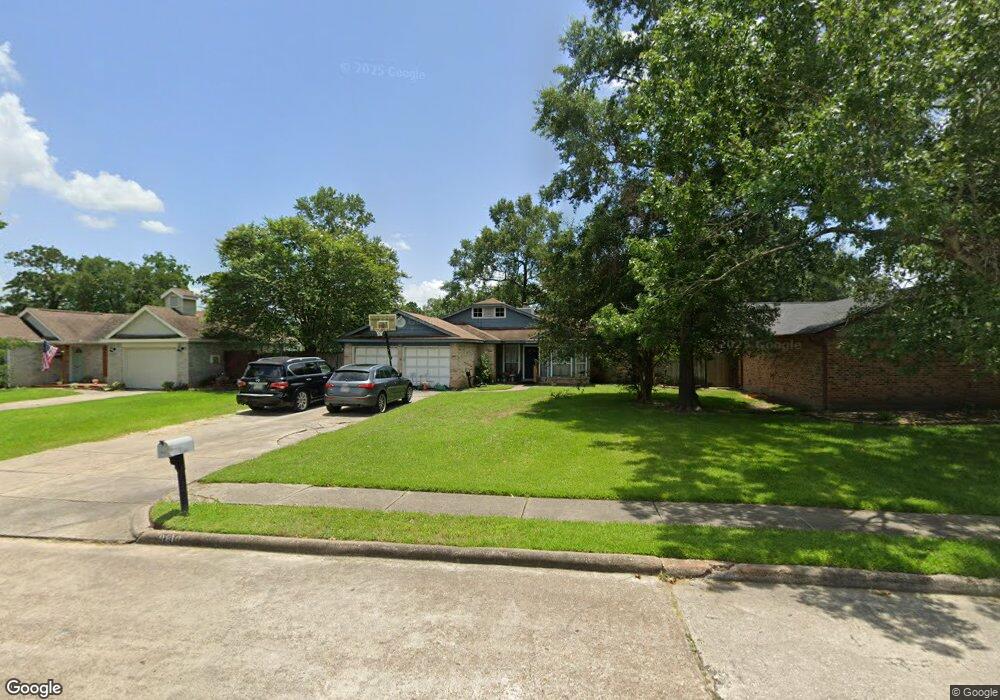
9810 Cassowary Dr Conroe, TX 77385
Estimated Value: $206,528 - $227,000
3
Beds
2
Baths
1,237
Sq Ft
$177/Sq Ft
Est. Value
About This Home
This home is located at 9810 Cassowary Dr, Conroe, TX 77385 and is currently estimated at $218,632, approximately $176 per square foot. 9810 Cassowary Dr is a home located in Montgomery County with nearby schools including Oak Ridge Elementary School, Irons J High School, and Vogel Intermediate School.
Ownership History
Date
Name
Owned For
Owner Type
Purchase Details
Closed on
Jul 15, 2009
Sold by
Reynolds Troy Dean and Reynolds Lilliana
Bought by
Birkhead Charla J
Current Estimated Value
Home Financials for this Owner
Home Financials are based on the most recent Mortgage that was taken out on this home.
Original Mortgage
$81,496
Outstanding Balance
$53,459
Interest Rate
5.41%
Mortgage Type
FHA
Estimated Equity
$165,173
Purchase Details
Closed on
Aug 21, 1996
Sold by
Callahan Carol Sue
Bought by
Reynolds Troy Dean and Reynolds Lilliana
Home Financials for this Owner
Home Financials are based on the most recent Mortgage that was taken out on this home.
Original Mortgage
$57,120
Interest Rate
8.42%
Mortgage Type
VA
Purchase Details
Closed on
Nov 5, 1990
Sold by
Christy Randell W
Bought by
High Charla J
Purchase Details
Closed on
Jun 1, 1987
Bought by
High Charla J
Create a Home Valuation Report for This Property
The Home Valuation Report is an in-depth analysis detailing your home's value as well as a comparison with similar homes in the area
Home Values in the Area
Average Home Value in this Area
Purchase History
| Date | Buyer | Sale Price | Title Company |
|---|---|---|---|
| Birkhead Charla J | -- | Vanguard Title | |
| Reynolds Troy Dean | -- | -- | |
| High Charla J | -- | -- | |
| High Charla J | -- | -- |
Source: Public Records
Mortgage History
| Date | Status | Borrower | Loan Amount |
|---|---|---|---|
| Open | Birkhead Charla J | $81,496 | |
| Previous Owner | Reynolds Troy Dean | $57,120 |
Source: Public Records
Tax History Compared to Growth
Tax History
| Year | Tax Paid | Tax Assessment Tax Assessment Total Assessment is a certain percentage of the fair market value that is determined by local assessors to be the total taxable value of land and additions on the property. | Land | Improvement |
|---|---|---|---|---|
| 2025 | $1,916 | $137,536 | $31,073 | $106,463 |
| 2024 | $1,743 | $143,347 | $31,073 | $112,274 |
| 2023 | $1,743 | $135,080 | $31,070 | $113,220 |
| 2022 | $2,519 | $122,800 | $31,070 | $106,930 |
| 2021 | $2,912 | $111,640 | $31,070 | $80,570 |
| 2020 | $2,896 | $105,010 | $31,070 | $83,610 |
| 2019 | $2,753 | $95,460 | $17,760 | $77,700 |
| 2018 | $1,979 | $88,440 | $17,760 | $70,680 |
| 2017 | $2,599 | $88,440 | $17,760 | $70,680 |
| 2016 | $2,456 | $83,560 | $17,760 | $65,800 |
| 2015 | $1,902 | $77,330 | $17,760 | $65,800 |
| 2014 | $1,902 | $70,300 | $17,760 | $52,880 |
Source: Public Records
Map
Nearby Homes
- 9807 Toucan Ln
- 16731 Foursquare Dr
- 16937 Larkspur
- 123 Genesee Ridge Dr
- 9838 Bobolink Dr
- 16859 Blackberry Lily Ln
- 74 Wimberly Way
- 9881 Youpon Ridge Way
- 9877 Lace Flower Way
- 16916 Tableland Trail
- 16778 N Gull Dr
- 16771 N Rail Dr
- 183 Fairwind Trail Dr
- 9903 Valance Way
- 16751 N Rail Dr
- 9915 Valance Way
- 9921 Kingfisher Dr
- 16774 Fallen Timbers Dr
- 10003 S Whimbrel Cir
- 3420 Chestnut Colony Ct
- 9806 Cassowary Dr
- 9814 Cassowary Dr
- 9811 Toucan Ln
- 9818 Cassowary Dr
- 9815 Toucan Ln
- 16879 Gleneagle Dr N
- 16883 Gleneagle Dr N
- 16887 Gleneagle Dr N
- 9811 Cassowary Dr
- 9807 Cassowary Dr
- 9815 Cassowary Dr
- 9819 Toucan Ln
- 16882 Canary St
- 16878 Canary St
- 16871 Gleneagle Dr N
- 16891 Gleneagle Dr N
- 9819 Cassowary Dr
- 16890 Canary St
- 9823 Cassowary Dr
- 16867 Gleneagle Dr N