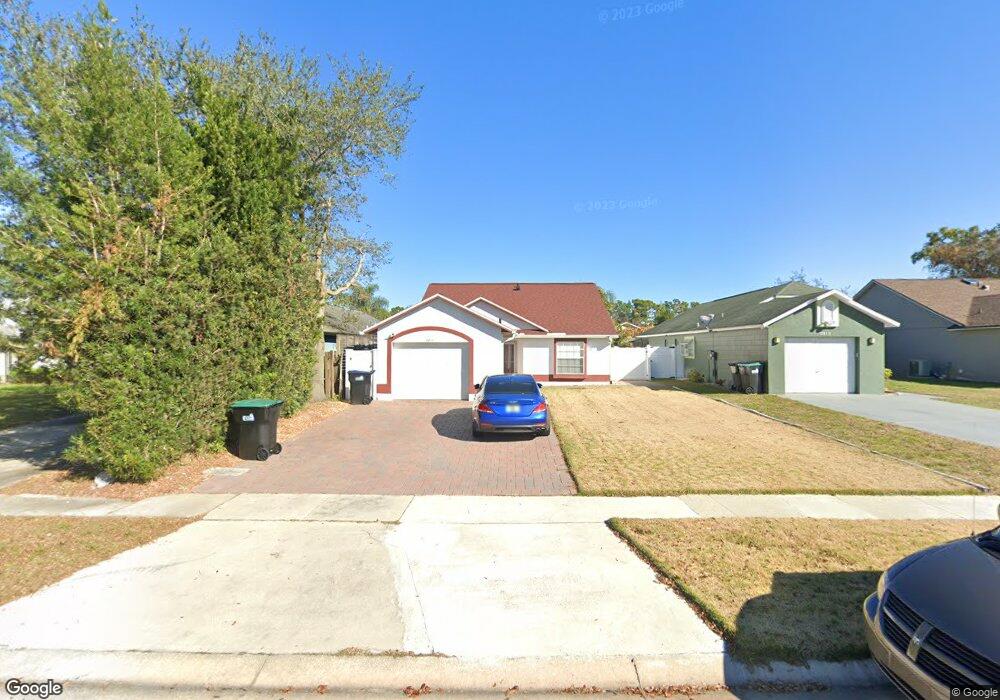
9811 Dean Acre Dr Orlando, FL 32825
Estimated Value: $308,000 - $343,000
3
Beds
2
Baths
1,266
Sq Ft
$262/Sq Ft
Est. Value
About This Home
This home is located at 9811 Dean Acre Dr, Orlando, FL 32825 and is currently estimated at $331,856, approximately $262 per square foot. 9811 Dean Acre Dr is a home located in Orange County with nearby schools including Union Park Elementary School, Union Park Middle School, and University High School.
Ownership History
Date
Name
Owned For
Owner Type
Purchase Details
Closed on
Jun 15, 2015
Sold by
Yelensky Sarah and Yelensky Kollin
Bought by
Ellis Shonnie D
Current Estimated Value
Home Financials for this Owner
Home Financials are based on the most recent Mortgage that was taken out on this home.
Original Mortgage
$119,201
Outstanding Balance
$95,496
Interest Rate
4.75%
Mortgage Type
FHA
Estimated Equity
$236,360
Purchase Details
Closed on
Mar 27, 2003
Sold by
Lidke Michael
Bought by
Yelensky Kollin and Yelensky Sarah
Home Financials for this Owner
Home Financials are based on the most recent Mortgage that was taken out on this home.
Original Mortgage
$111,500
Interest Rate
5.74%
Mortgage Type
Purchase Money Mortgage
Purchase Details
Closed on
Aug 29, 1997
Sold by
Mallick Christopher J
Bought by
Lidke Michael
Purchase Details
Closed on
Jun 13, 1994
Sold by
Austin Bruce R and Austin Malee P
Bought by
Mallick Christopher J
Create a Home Valuation Report for This Property
The Home Valuation Report is an in-depth analysis detailing your home's value as well as a comparison with similar homes in the area
Home Values in the Area
Average Home Value in this Area
Purchase History
| Date | Buyer | Sale Price | Title Company |
|---|---|---|---|
| Ellis Shonnie D | $121,400 | Prominence Title & Escr | |
| Yelensky Kollin | $115,000 | Total Trust Title Inc | |
| Lidke Michael | $74,000 | -- | |
| Mallick Christopher J | $31,450 | -- |
Source: Public Records
Mortgage History
| Date | Status | Borrower | Loan Amount |
|---|---|---|---|
| Open | Ellis Shonnie D | $119,201 | |
| Previous Owner | Yelensky Kollin | $111,500 |
Source: Public Records
Tax History Compared to Growth
Tax History
| Year | Tax Paid | Tax Assessment Tax Assessment Total Assessment is a certain percentage of the fair market value that is determined by local assessors to be the total taxable value of land and additions on the property. | Land | Improvement |
|---|---|---|---|---|
| 2025 | $1,928 | $137,113 | -- | -- |
| 2024 | $1,803 | $137,113 | -- | -- |
| 2023 | $1,803 | $129,368 | $0 | $0 |
| 2022 | $1,714 | $125,600 | $0 | $0 |
| 2021 | $1,675 | $121,942 | $0 | $0 |
| 2020 | $1,583 | $120,258 | $0 | $0 |
| 2019 | $1,615 | $117,554 | $0 | $0 |
| 2018 | $1,592 | $115,362 | $0 | $0 |
| 2017 | $1,554 | $124,067 | $21,200 | $102,867 |
| 2016 | $1,525 | $110,665 | $20,000 | $90,665 |
| 2015 | $2,153 | $106,962 | $20,000 | $86,962 |
| 2014 | -- | $96,569 | $20,000 | $76,569 |
Source: Public Records
Map
Nearby Homes
- 9850 Flynt Cir
- 9838 Piney Point Cir
- 9814 Piney Point Cir
- 1234 Tino Ct
- 10131 Cypress Glen Place
- 751 Oak Manor Cir
- 719 Oak Manor Cir
- 10140 Bridlewood Ave
- 9616 River Walk Ct
- 10320 Brownwood Ave
- 1432 Selma Ave
- 1607 Lake Downey Dr
- 1206 Culver Rd
- 1139 Chambord Ct
- 1813 N Dean Rd
- 0 Culver Rd
- 9333 Shepton St
- 992 Vista Palma Way
- 9213 Ventana Ln
- 615 Maple Forest Dr
- 9815 Dean Acre Dr
- 9809 Dean Acre Dr
- 9817 Dean Acre Dr
- 9803 Dean Acre Dr
- 9823 Dean Acre Dr
- 9801 Dean Acre Dr
- 9818 Dean Cove Ln
- 9814 Dean Cove Ln
- 9820 Dean Cove Ln
- 9812 Dean Cove Ln
- 9824 Dean Cove Ln
- 9825 Dean Acre Dr
- 9808 Dean Cove Ln
- 9719 Dean Acre Ct
- 9826 Dean Cove Ln
- 9810 Dean Acre Dr
- 9812 Dean Acre Dr
- 9804 Dean Acre Dr
- 9818 Dean Acre Dr